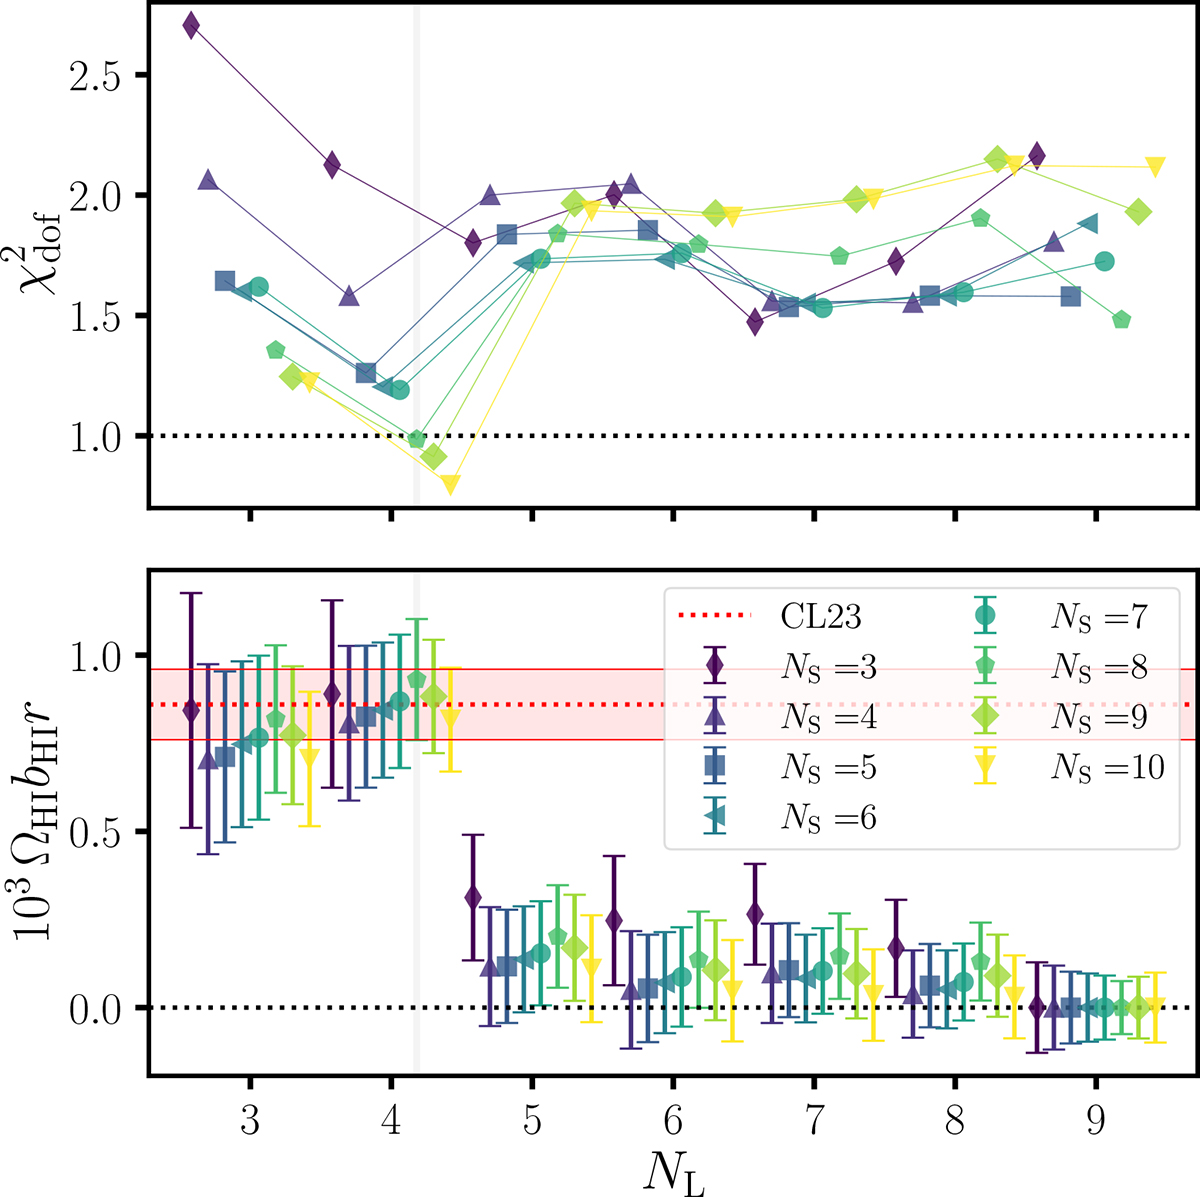
Fig. 15.
Download original image
Sensitivity of our results to the mPCA contaminant subtraction as function of how many modes have been removed from the original cube. The top panel shows the reduced χ2 for each foreground cleaned cross-power spectra relative to its best-fitting model. The bottom panel the corresponding best-fitting ΩH I bH Ir values and their 1σ error bars. All quantities are plotted as a function of the Nfg pair of the mPCA analysis, with NL on the x-axis and NS colour- and symbol-coded spanning from NS = 3 in violet to NS = 10 in yellow. For comparison, the shaded red region highlights the CL23 best-fitting value and 1σ uncertainty, that was obtained with a 𝒯-correction (the ‘uncorrected’ CL23 amplitude would lay between 0.2 − 0.3 × 10⁻³). We highlight in grey the NL, NS = 4, 8 results that correspond to our best and reference mPCA result. Results from mSVD and the weighted mSVDw and mPCAw show negligible differences.
Current usage metrics show cumulative count of Article Views (full-text article views including HTML views, PDF and ePub downloads, according to the available data) and Abstracts Views on Vision4Press platform.
Data correspond to usage on the plateform after 2015. The current usage metrics is available 48-96 hours after online publication and is updated daily on week days.
Initial download of the metrics may take a while.