Fig. 16.
Download original image
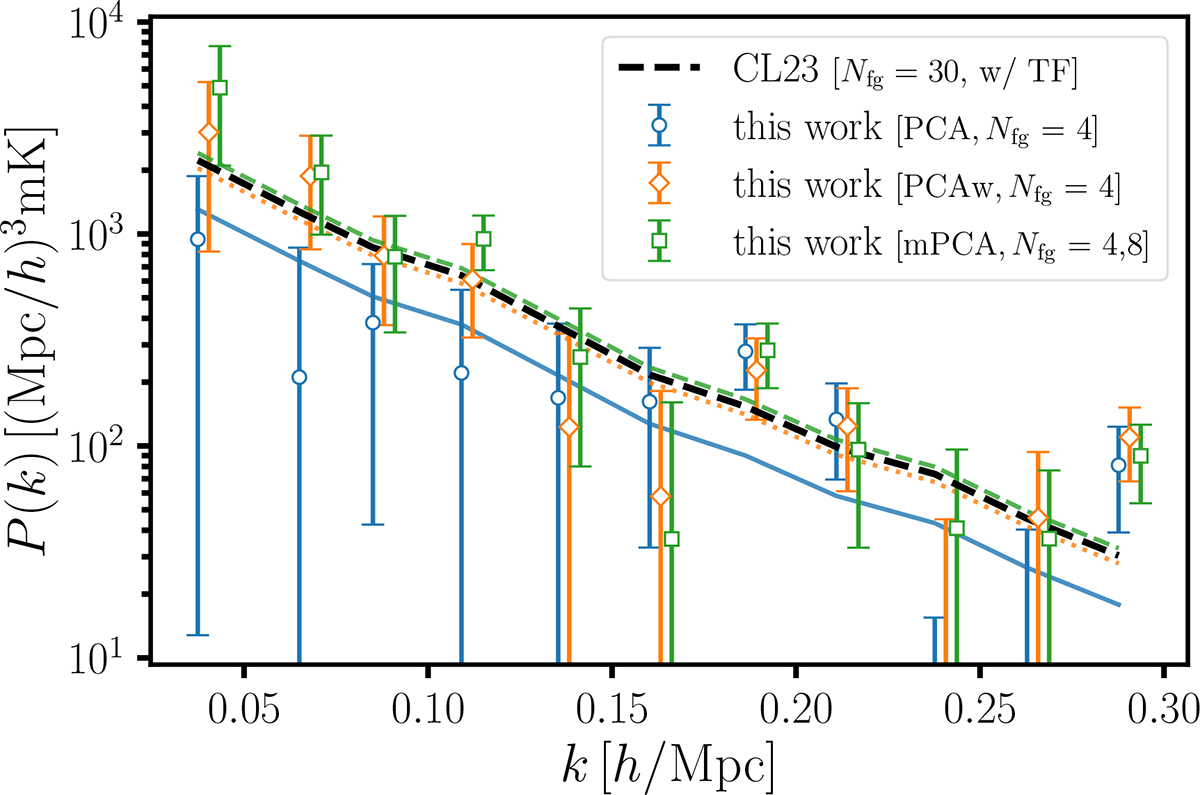
Cross-power spectra between WiggleZ galaxies and MeerKAT H I intensity maps at redshift z ≈ 0.4. Maps have been cleaned by a PCA and PCAw analysis with Nfg = 4 (blue circles and orange diamonds respectively) and by mPCA with NL, NS = 4, 8 (green squares). We show error bars with 1σ uncertainties and the resulting best-fit curves (solid blue for PCA, dotted orange for PCAw and dashed green for mPCA). The black dashed line is the fitted model from CL23 (same data, different cleaning strategy) that instead was enhanced by a transfer function correction.
Current usage metrics show cumulative count of Article Views (full-text article views including HTML views, PDF and ePub downloads, according to the available data) and Abstracts Views on Vision4Press platform.
Data correspond to usage on the plateform after 2015. The current usage metrics is available 48-96 hours after online publication and is updated daily on week days.
Initial download of the metrics may take a while.