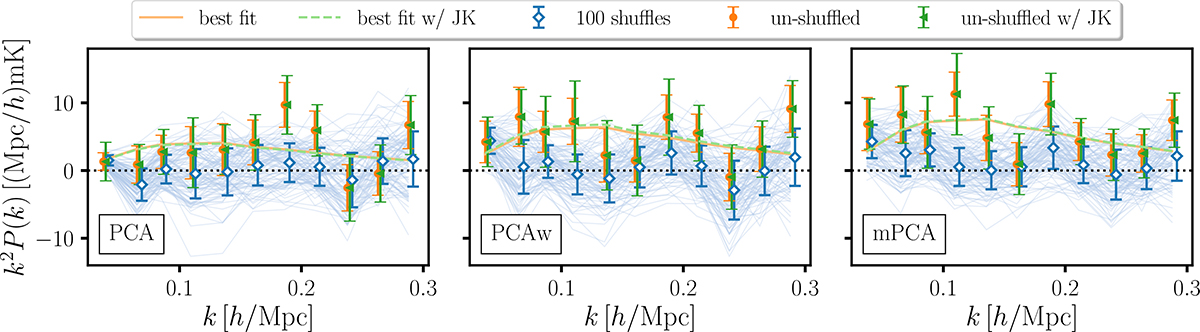
Fig. 17.
Download original image
Null tests for the cross-power spectra derived with the PCA Nfg = 4 (left panel), its weighted version PCAw Nfg = 4 (middle) and multiscale version mPCA NL, NS = 4, 8 (right). The WiggleZ galaxy maps have been shuffled along frequency (redshift). The thin blue lines show the spectra computed for 100 different shuffles. Empty blue diamonds correspond to the average and standard deviation across the shuffled samples, that we compare against (i) the reference spectra (filled orange circles) and (ii) the reference spectra with jackknife errors (filled green triangles). We use the solid orange and dashed green lines to show the best fits of the reference spectra, using Gaussian and jackknife errors respectively.
Current usage metrics show cumulative count of Article Views (full-text article views including HTML views, PDF and ePub downloads, according to the available data) and Abstracts Views on Vision4Press platform.
Data correspond to usage on the plateform after 2015. The current usage metrics is available 48-96 hours after online publication and is updated daily on week days.
Initial download of the metrics may take a while.