Fig. 22.
Download original image
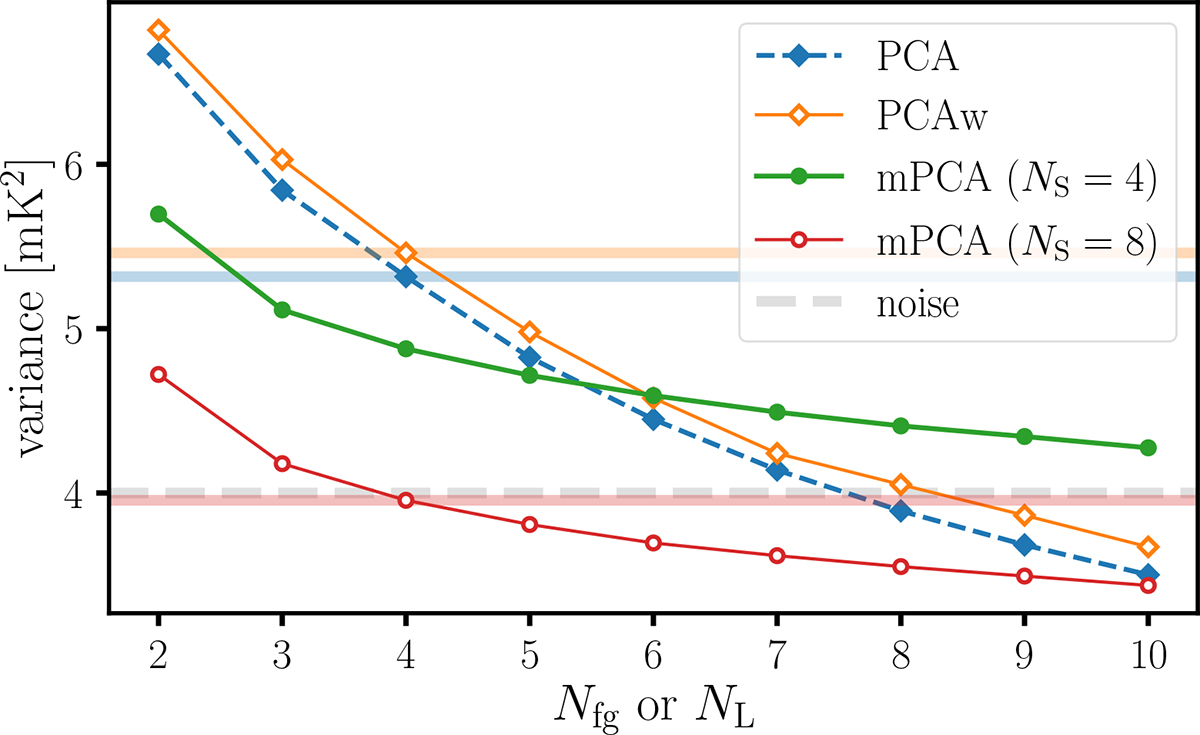
Variance in the cleaned cubes as a function of the number of components removed: Nfg or NL for PCA (dashed blue line), PCAw (solid orange), and mPCA (solid green setting NS = 4 and solid red for NS = 8). Horizontal stripes with corresponding colours highlight the variance level of the reference cube for each method (Nfg = 4 for PCA and PCAw and NL, NS = 4, 8 for mPCA), namely the solutions for each method that offer a maximised goodness-of-fit and amplitude when cross-correlated with the galaxy catalogue. For reference, the variance of the original, unclean cube corresponds to ≈9 × 10³ mK2 and is characterised by the noise level highlighted by the dashed gray stripe.
Current usage metrics show cumulative count of Article Views (full-text article views including HTML views, PDF and ePub downloads, according to the available data) and Abstracts Views on Vision4Press platform.
Data correspond to usage on the plateform after 2015. The current usage metrics is available 48-96 hours after online publication and is updated daily on week days.
Initial download of the metrics may take a while.