Fig. 23.
Download original image
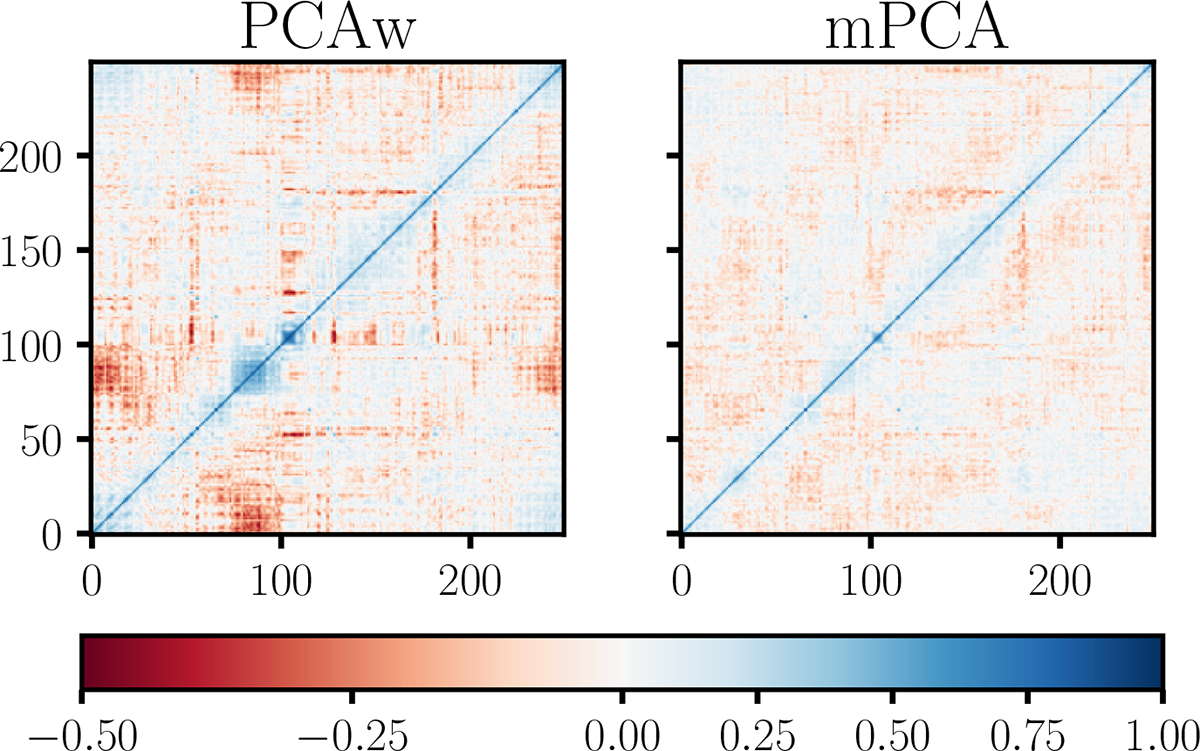
Frequency-frequency correlation matrices of the cleaned cubes, PCAw with Nfg = 4 on the left and mPCA with NL, NS = 4, 8 on the right. Zero correlation corresponds to the white colour. Both matrices show the expected positive diagonal structure of the H I IM signal. The mPCA solution results in fewer off-diagonal contributions.
Current usage metrics show cumulative count of Article Views (full-text article views including HTML views, PDF and ePub downloads, according to the available data) and Abstracts Views on Vision4Press platform.
Data correspond to usage on the plateform after 2015. The current usage metrics is available 48-96 hours after online publication and is updated daily on week days.
Initial download of the metrics may take a while.