Fig. A.1.
Download original image
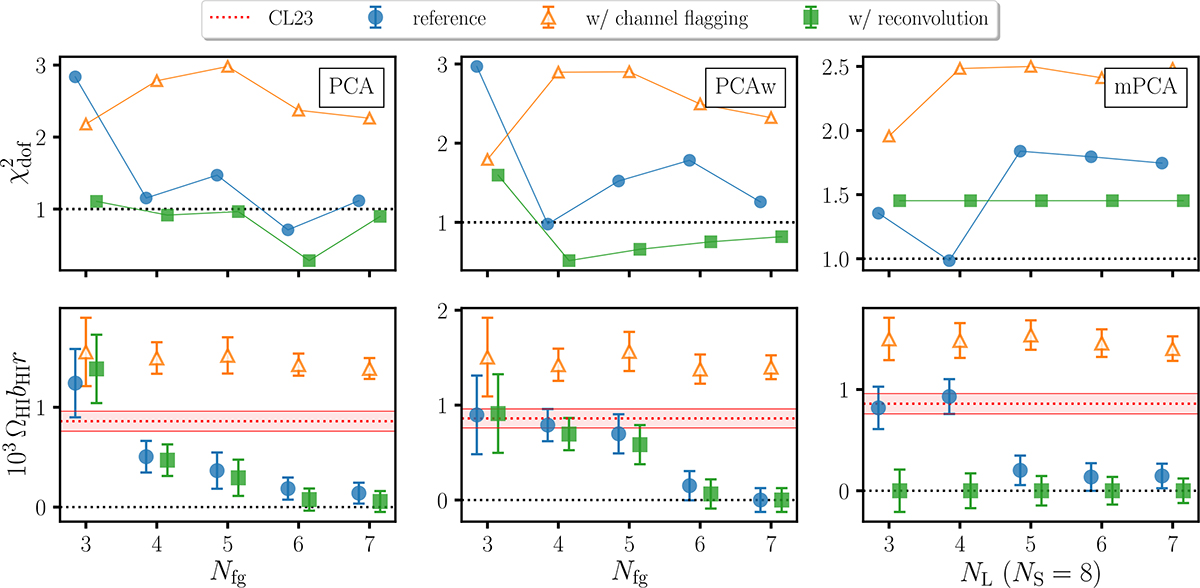
Top panels: Reduced χdof2 of the cross-power best-fits. Bottom panels: Corresponding amplitude values compared to the CL23 result in red, as functions of the cleaning level. Columns correspond to PCA, PCAw and mPCA from left to right. The filled blue circles correspond to the ‘standard’ reference analysis; the empty orange triangle to the analysis with the extra flagging of ∼20% of the channels before the component separation; the filled green squares correspond to the analysis performed reconvolving all maps before the component separation.
Current usage metrics show cumulative count of Article Views (full-text article views including HTML views, PDF and ePub downloads, according to the available data) and Abstracts Views on Vision4Press platform.
Data correspond to usage on the plateform after 2015. The current usage metrics is available 48-96 hours after online publication and is updated daily on week days.
Initial download of the metrics may take a while.