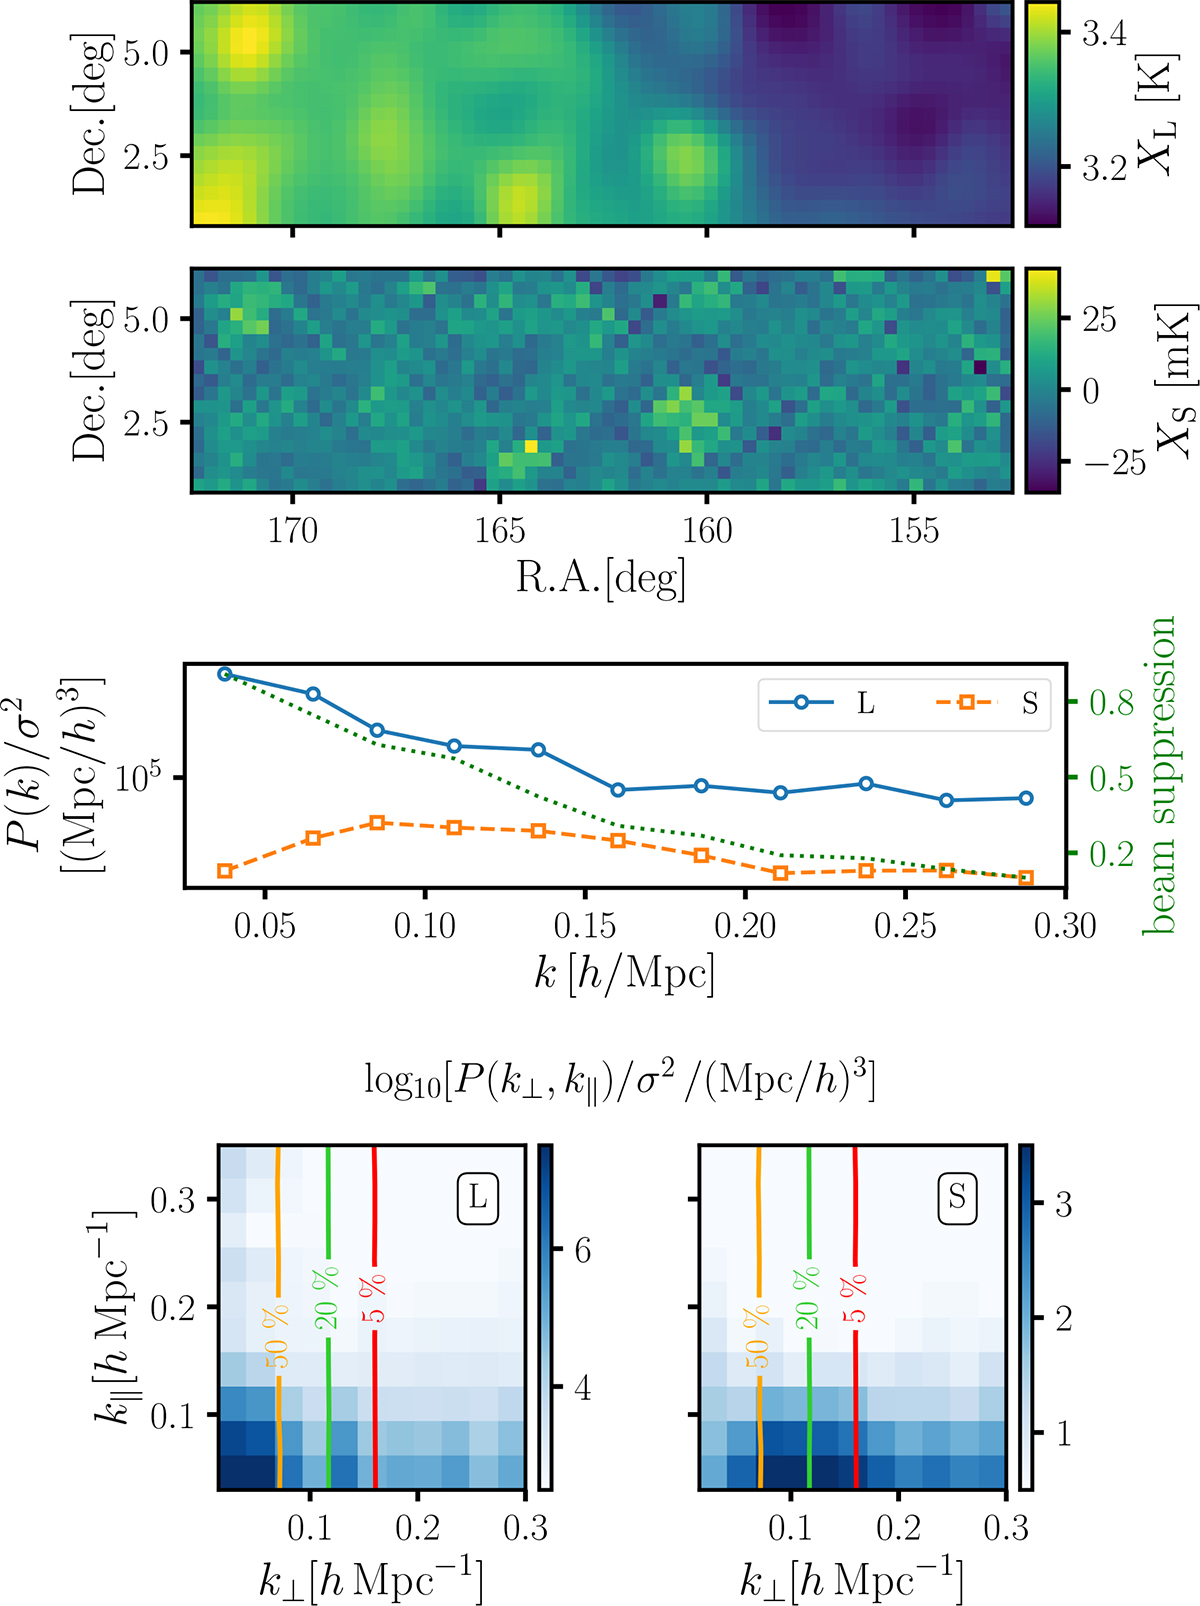
Fig. 3.
Download original image
First two panels: Wavelet-filtered large (first panel) and small scale (second) temperature sky map within the conservative footprint (CF) and averaged along all frequencies; i.e. the sum of the two maps above gives precisely the original one (within the cyan contour) in Fig. 1. Third panel: Spherically averaged power spectra of the cubes (large scale in solid blue, small in dashed orange) normalised by the variance of each cube. With a green dotted line, we plot the damping term of the telescope beam (refer to the y-axis at the right of the panel). Bottom panels: Cylindrical power spectra of the large (left panel) and small-scale cubes (right). Since the wavelet filtering is performed in the angular direction, the difference among the resulting cubes is mostly visible along k⊥ (x-axis). The beam suppression also acts in this direction: we plot its expected damping term with iso-contour solid lines corresponding to 50, 20, and 5% suppression, from left toright.
Current usage metrics show cumulative count of Article Views (full-text article views including HTML views, PDF and ePub downloads, according to the available data) and Abstracts Views on Vision4Press platform.
Data correspond to usage on the plateform after 2015. The current usage metrics is available 48-96 hours after online publication and is updated daily on week days.
Initial download of the metrics may take a while.