Fig. 5.
Download original image
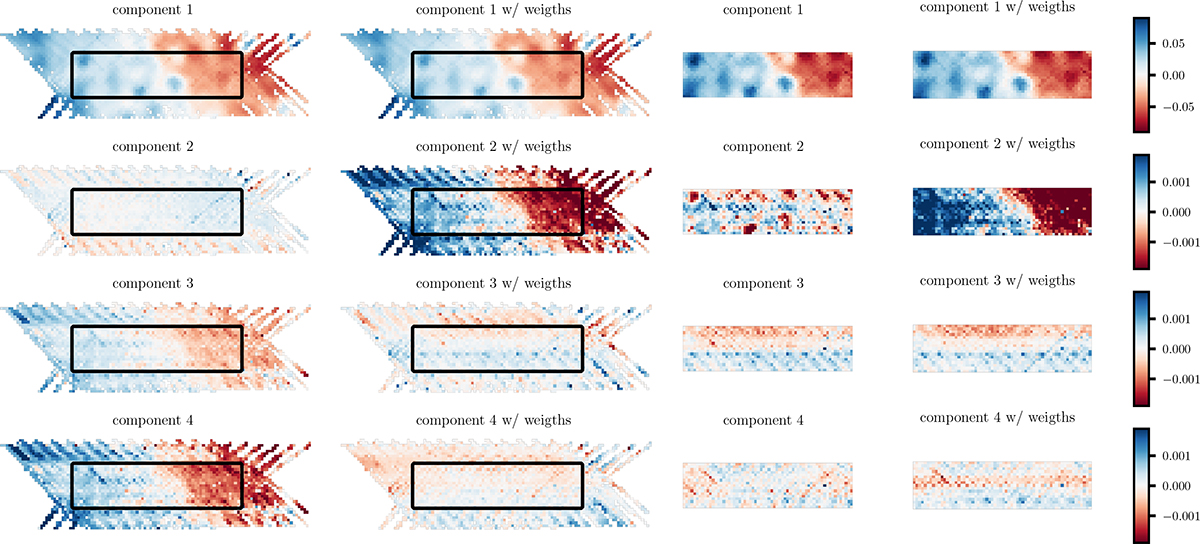
First four components ![]() to
to ![]() (from top to bottom) in the case where we apply PCA on the original footprint OF (first column) or on the conservative footprint CF (third column) and in the cases where we apply a weighted PCAw (second and fourth columns). All plotted maps are normalised to highlight each component’s spatial features and pixel variance. Component-number (row) wise, we impose the same range of values as per the colour bars on the right. Some sources get saturated, highlighting the higher pixel variance they capture than the unsaturated counterparts (especially for the second component). The black contours in the OF maps in the first two columns mark the CF boundaries.
(from top to bottom) in the case where we apply PCA on the original footprint OF (first column) or on the conservative footprint CF (third column) and in the cases where we apply a weighted PCAw (second and fourth columns). All plotted maps are normalised to highlight each component’s spatial features and pixel variance. Component-number (row) wise, we impose the same range of values as per the colour bars on the right. Some sources get saturated, highlighting the higher pixel variance they capture than the unsaturated counterparts (especially for the second component). The black contours in the OF maps in the first two columns mark the CF boundaries.
Current usage metrics show cumulative count of Article Views (full-text article views including HTML views, PDF and ePub downloads, according to the available data) and Abstracts Views on Vision4Press platform.
Data correspond to usage on the plateform after 2015. The current usage metrics is available 48-96 hours after online publication and is updated daily on week days.
Initial download of the metrics may take a while.