Fig. 6.
Download original image
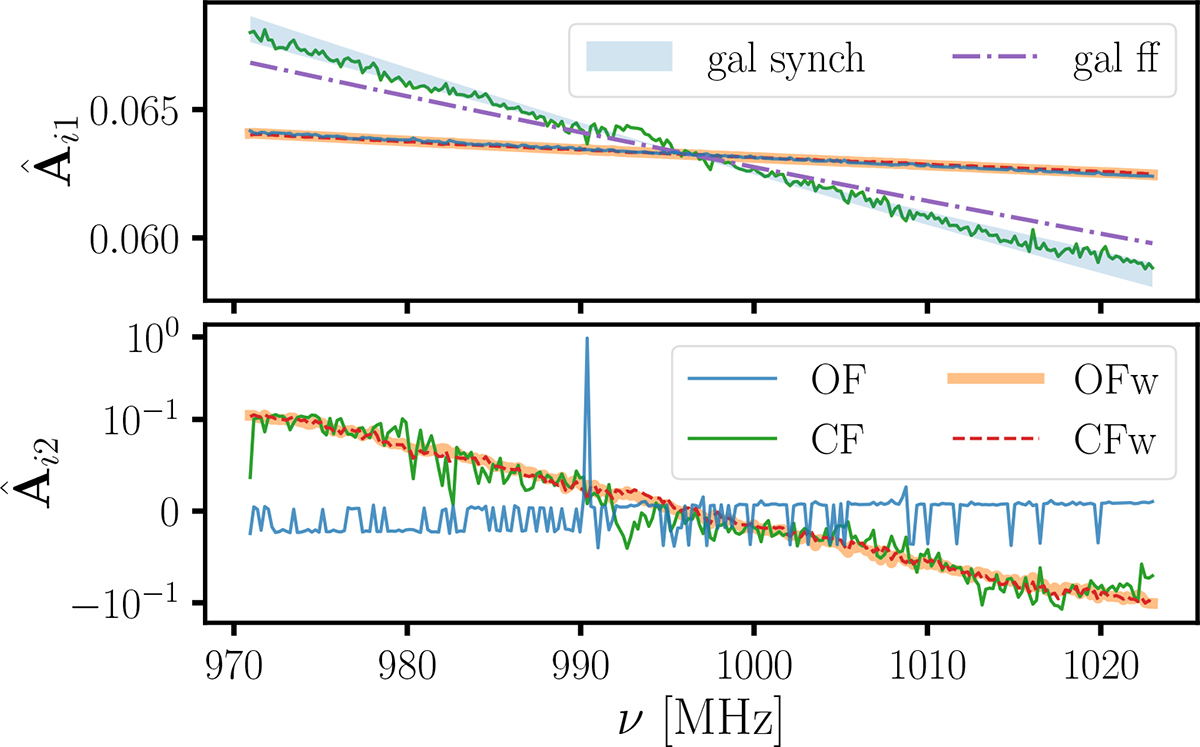
Normalised first two modes derived by the PCA analysis performed on the original footprint OF (solid blue line) and the conservative footprint CF (solid orange), and their weighted version ‘OFw’ (solid green) and ‘CFw’ (red dashed). For comparison, in the first mode plot (top panel), we show a proxy for the spectral index of the galactic free-free emission (dash-dotted, spectral index of −2.13, Dickinson et al. 2003) and a range of possible galactic synchrotron spectral indexes (blue shaded area, between −3.2 and −2.6, Irfan et al. 2022).
Current usage metrics show cumulative count of Article Views (full-text article views including HTML views, PDF and ePub downloads, according to the available data) and Abstracts Views on Vision4Press platform.
Data correspond to usage on the plateform after 2015. The current usage metrics is available 48-96 hours after online publication and is updated daily on week days.
Initial download of the metrics may take a while.