Fig. 7.
Download original image
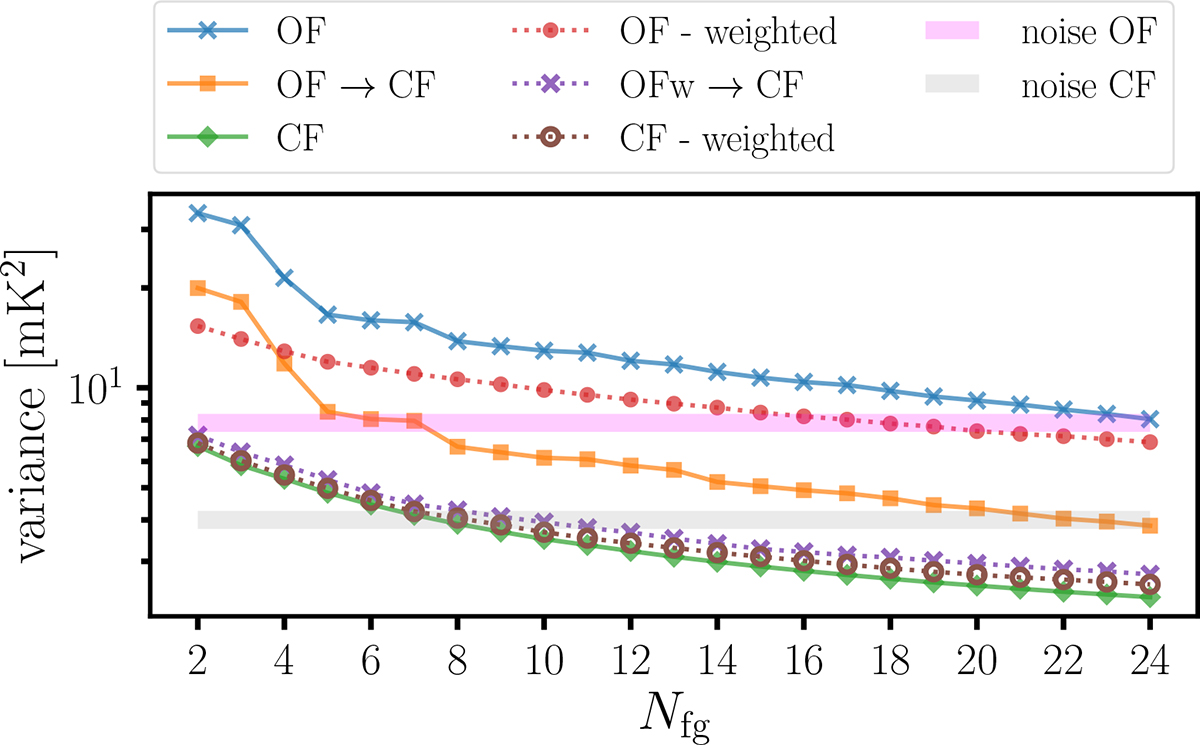
Variance in the PCA-cleaned cubes as a function of Nfg. The solid blue line corresponds to a PCA cleaning applied to the original footprint OF that, if cropped a-posteriori on the smaller CF, corresponds to the variance displayed by the solid orange line. The solid green line corresponds to PCA performed directly on the CF. We compare these results with a weighted PCAw with dotted lines, in the OF case (red), OF-later-cropped (violet) and CF (brown). The horizontal stripes mark the estimated noise level of the OF (pink) and CF (grey) cubes. These results do not change for an SVD analysis.
Current usage metrics show cumulative count of Article Views (full-text article views including HTML views, PDF and ePub downloads, according to the available data) and Abstracts Views on Vision4Press platform.
Data correspond to usage on the plateform after 2015. The current usage metrics is available 48-96 hours after online publication and is updated daily on week days.
Initial download of the metrics may take a while.