Fig. 1.
Download original image
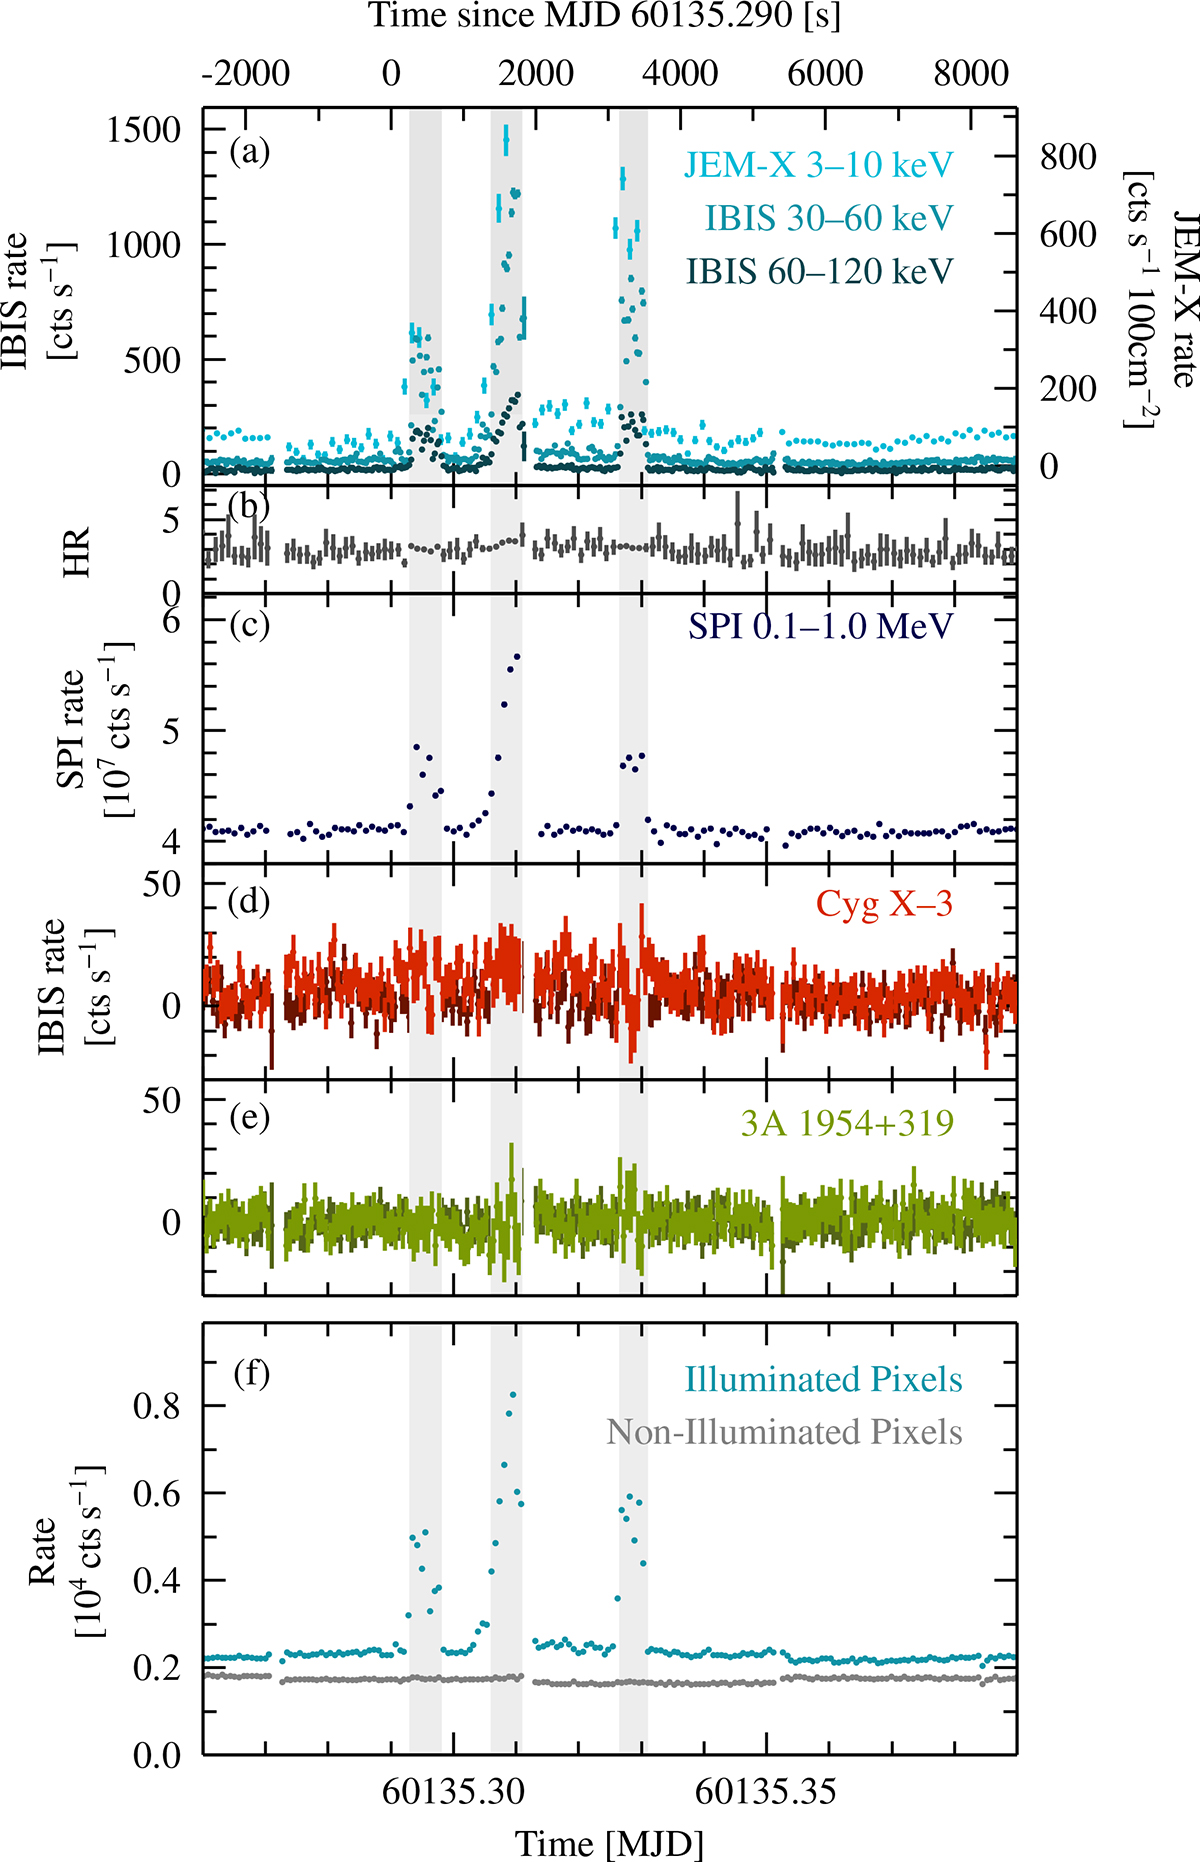
Variability of Cyg X-1 on July 10, 2023. (a) IBIS and JEM-X light curves of the flares during rev. 2661. Gray bands indicate the time ranges of the flares. (b) Variation of the hardness ratio, HR = (H − S)/(H + S), between the 30–60 keV and 60–120 keV IBIS light curves. (c) Evolution of the total event rate in the SPI detector, dominated by Cyg X-1. (d) and (e) IBIS light curves for the two other sources, Cyg X-3 and 3A 1954+319, which are unaffected by the flare of Cyg X-1 in the field of view. Lighter colors indicate the 30–60 keV rate, and the darker ones indicate the 60–120 keV rate. (f) Count rates in those pixels of IBIS illuminated and non-illuminated by Cyg X-1. The changes in the base count rate around MJD 60135.27, MJD 60135.31, and MJD 60135.35 are due to the repointing of INTEGRAL, resulting in a change in the number of (non-)illuminated pixels and of the vignetting of the source.
Current usage metrics show cumulative count of Article Views (full-text article views including HTML views, PDF and ePub downloads, according to the available data) and Abstracts Views on Vision4Press platform.
Data correspond to usage on the plateform after 2015. The current usage metrics is available 48-96 hours after online publication and is updated daily on week days.
Initial download of the metrics may take a while.