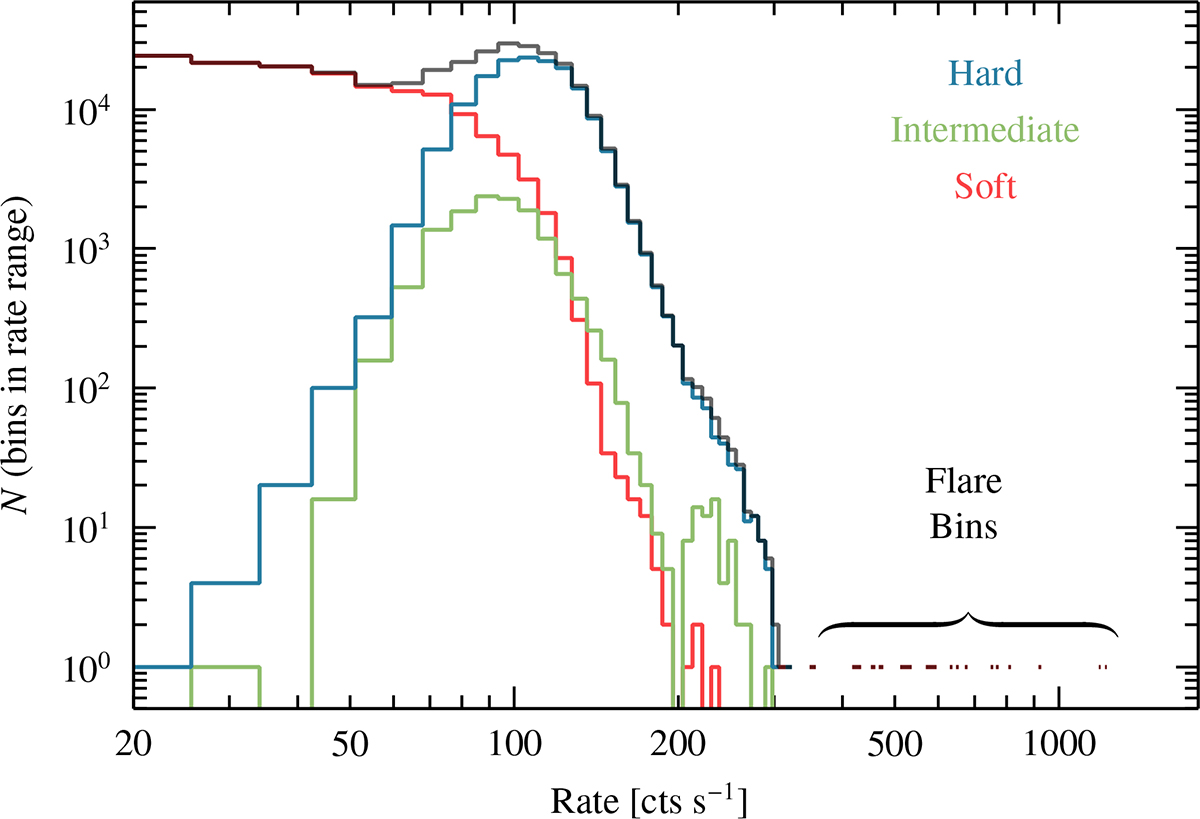
Fig. 2.
Download original image
Distribution of count rates in 60 s bins for all IBIS observations of Cyg X-1, separated by state as determined following Grinberg et al. (2013). The bin width of the rate histogram is 80 cts s−1. The count rates reached by the flares discussed in this paper are indicated within the bracket. At no time before the flares have rates of 350 cts s−1 or higher been reached. Therefore, the flares by far represent the brightest observations ever seen with IBIS for Cyg X-1.
Current usage metrics show cumulative count of Article Views (full-text article views including HTML views, PDF and ePub downloads, according to the available data) and Abstracts Views on Vision4Press platform.
Data correspond to usage on the plateform after 2015. The current usage metrics is available 48-96 hours after online publication and is updated daily on week days.
Initial download of the metrics may take a while.