Fig. 3.
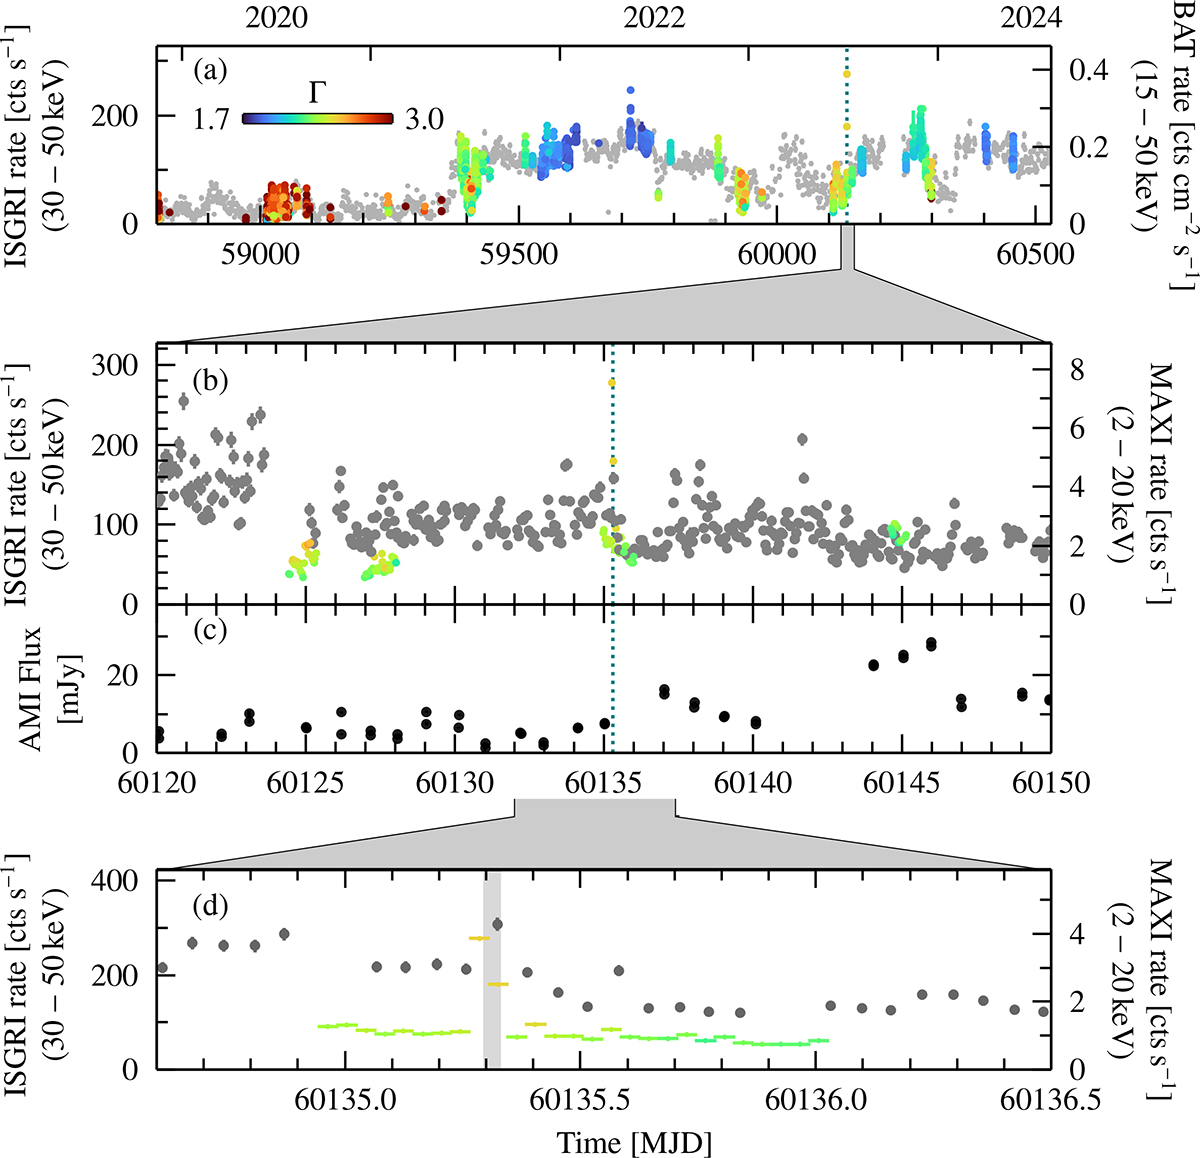
Download original image
Long-term IBIS and BAT light curve of Cyg X-1. The top panel shows the source behavior in a broader context, while the lower panels focus on the days surrounding the flare. (a) Swift/BAT (gray) and IBIS count rates, colored by the photon index of the corresponding Science Window, determined by applying the bknpower model. The canonical state of Cyg X-1 derived from the MAXI light curves according to Grinberg et al. (2014) is shown in the color strip at the top edge of the panel. The time of the flaring episode is indicated by the vertical dotted teal line. (b) IBIS data: same as that shown in (a), but focusing on a shorter time interval and including the MAXI rates instead of the Swift/BAT rates. (c) The radio flux density measured with AMI. (d) MAXI on-demand data (gray), together with the IBIS data colored as above). The interval between start of the first and end of the third flare is shaded in light gray and the length of each pointing is indicated by the horizontal error bars. A slight increase in the MAXI flux is visible around the time of the flare.
Current usage metrics show cumulative count of Article Views (full-text article views including HTML views, PDF and ePub downloads, according to the available data) and Abstracts Views on Vision4Press platform.
Data correspond to usage on the plateform after 2015. The current usage metrics is available 48-96 hours after online publication and is updated daily on week days.
Initial download of the metrics may take a while.