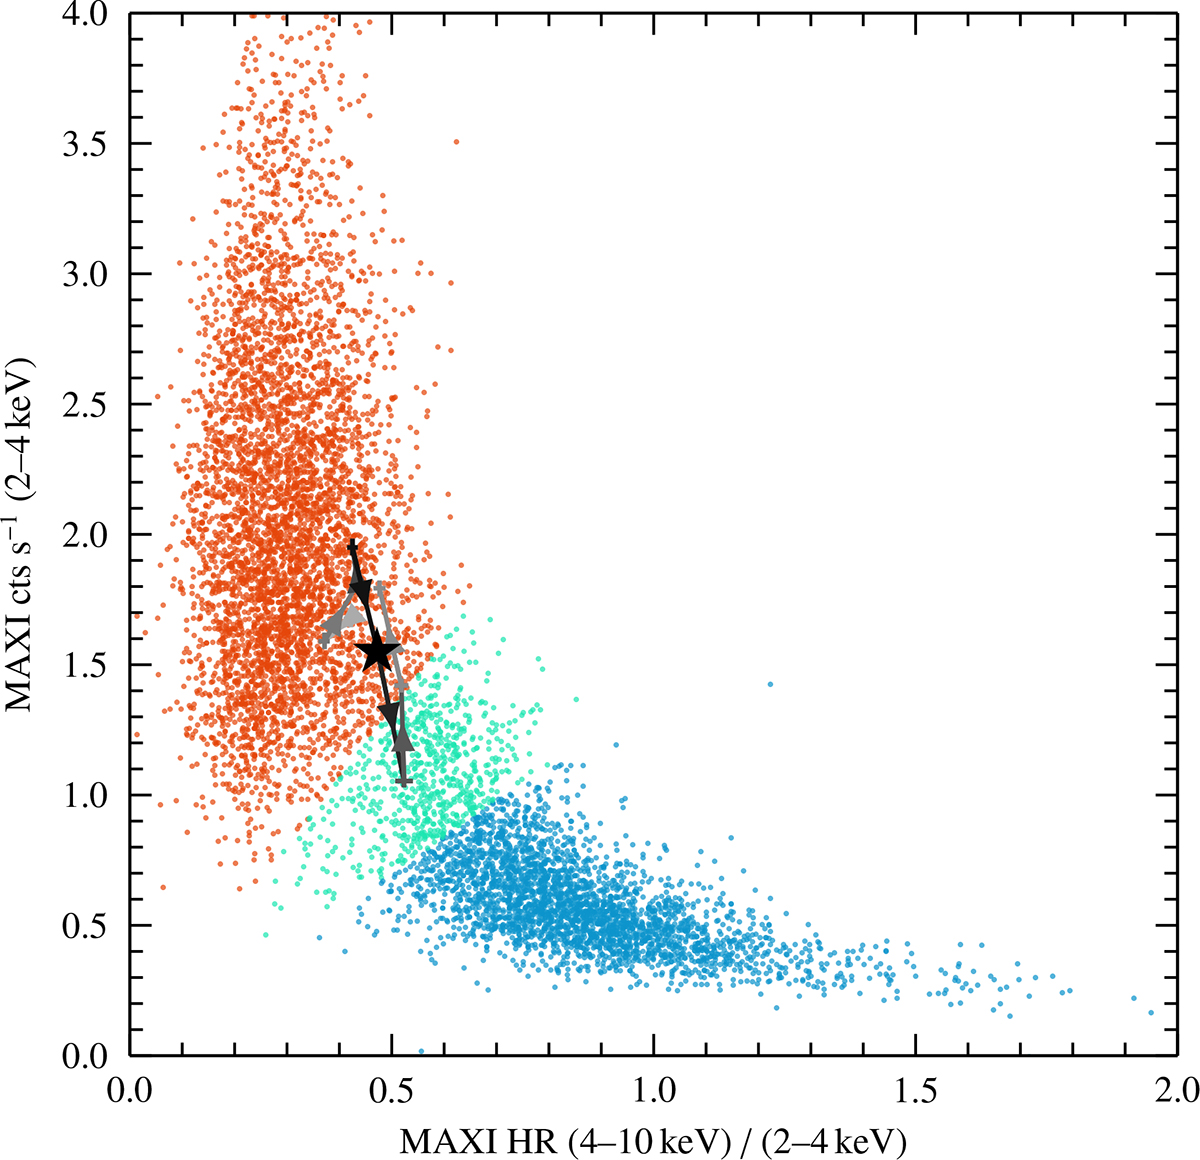
Fig. 4.
Download original image
Hardness–intensity diagram of Cyg X-1 determined from MAXI data. The position of Cyg X-1 during the flare is indicated by the black star. Red, green, and blue dots indicate individual bins in the daily light curves of MAXI, classified as soft, intermediate or hard state, respectively (Grinberg et al. 2013). The source behavior four days before and four days after the flaring episode is indicated by arrows pointing toward later observations and becoming lighter with increased separation from the flare.
Current usage metrics show cumulative count of Article Views (full-text article views including HTML views, PDF and ePub downloads, according to the available data) and Abstracts Views on Vision4Press platform.
Data correspond to usage on the plateform after 2015. The current usage metrics is available 48-96 hours after online publication and is updated daily on week days.
Initial download of the metrics may take a while.