| Issue |
A&A
Volume 703, November 2025
|
|
|---|---|---|
| Article Number | A233 | |
| Number of page(s) | 9 | |
| Section | Atomic, molecular, and nuclear data | |
| DOI | https://doi.org/10.1051/0004-6361/202453590 | |
| Published online | 20 November 2025 | |
Formation of diphosphorus (P2+) and phosphorus mononitride (PN+) cations by radiative association
1
Institute of Atomic and Molecular Physics, Jilin University,
Changchun
130012,
China
2
Instituto de Astronomia, Geofísica e Ciências Atmosféricas, Universidade de São Paulo,
Rua do Matão 1226,
05508-090,
São Paulo,
SP,
Brazil
3
Instituto de Geociências e Ciências Exatas, Universidade Estadual Paulista,
Av. 24A,
13506-900
Rio Claro,
SP,
Brazil
★ Corresponding author: This email address is being protected from spambots. You need JavaScript enabled to view it.
Received:
23
December
2024
Accepted:
25
September
2025
Abstract
We estimated radiative association rate coefficients for P(4S) atoms and P+(3P) ions interacting with P(4S) and N(4S) atoms to form P2+ and PN+ cations, respectively. The required potential energy curves of P2+ and PN+ and the transition dipole moments coupling the states of interest were obtained using the multi-reference configuration interaction approach with a Davidson correction (MRCI+Q). The rate coefficients were obtained from the cross-sections, which were computed using a quantum mechanical method. The maximum rate constant values we predict are 3.13×10⁻¹⁹ cm3 s−1 at 10 K for the PN+ cation and 1.66×10⁻¹⁶ cm3 s−1 at 3500→6000 K for the P2+ cation. For the convenience of astrochemical applications, the thermal rate constants were fitted to the standard equation, k(T) = A(T/300)α eβ/T.
Key words: astrochemistry / molecular data / molecular processes
© The Authors 2025
 Open Access article, published by EDP Sciences, under the terms of the Creative Commons Attribution License (https://creativecommons.org/licenses/by/4.0), which permits unrestricted use, distribution, and reproduction in any medium, provided the original work is properly cited.
This article is published in open access under the Subscribe to Open model. This email address is being protected from spambots. You need JavaScript enabled to view it. to support open access publication.
1 Introduction
Phosphorus is a fundamental component of many biological molecules and is therefore very important in biochemistry. It is a key element needed for life on Earth and can play a significant role in exoplanet chemistry (e.g. Sousa-Silva et al. 2020; Hinkel et al. 2020). In space, phosphorus-bearing compounds have been observed in the dust components of 1P/Halley (Kissel & Krueger 1987), 81P/Wild 2 (Flynn et al. 2006), and 67P/Churyumov-Gerasimenko (67P/C–G) (Gardner et al. 2020). Meteorites contain several different phosphorus-bearing minerals, the most important being nickel-iron phosphide, also known as schreibersite ((Ni, Fe)3P) (Lewis & Jones 2016). The atomic P has been found in the comet 67P/C-G in the gas phase (Altwegg et al. 2016; Rivilla et al. 2020) and towards dwarf (Caffau et al. 2016) and giant stars (Maas et al. 2017). The atomic ion P+ has been detected in diffuse clouds (Jura & York 1978; Lebouteiller et al. 2005) and towards the supernova remnant Cas A (Koo et al. 2013) and extragalactic objects (Molaro et al. 2001; Otsuka et al. 2011). Several P-bearing molecules have been observed in the circumstellar envelope of evolved stars, including PO, PN, CP, HCP, CCP, NCCP, and PH3 (Guelin et al. 1990; Cernicharo et al. 2000; Agúndez et al. 2007, 2014a,b; Tenenbaum et al. 2007; Halfen et al. 2008), and one (SiP) has been tentatively identified (Koelemay et al. 2022). Only PN, PO, and PO+ have been discovered in interstellar medium (Turner & Bally 1987; Ziurys 1987; Lefloch et al. 2016; Rivilla et al. 2016, 2022; Koelemay et al. 2023). PN has also been observed in extragalactic sources (Haasler et al. 2022), PH3 has been detected in the atmospheres of Jupiter (Larson et al. 1977) and Saturn (Bregman et al. 1975), and PO has been identified in the comet 67P/C-G (Altwegg et al. 2016; Rivilla et al. 2020).
Nitrogen also plays a critical role in the biochemistry of Earth. Atomic nitrogen has been detected in diffuse interstellar medium in the gas phase (York et al. 1983; Meyer et al. 1997), and N+ lines have been observed in the ionized gas associated with low-density ionized interstellar gas (Persson et al. 2014). In molecular form, more than 120 N-bearing species have been identified in interstellar and/or circumstellar environments1, including the cations NO+, NS+, N2H+, and NH4+. Nitrogen-containing molecules, such as NS, NO, and HCN, are found also in extragalactic sources (Chin et al. 1999; Martín et al. 2003). Within the Solar System, molecular nitrogen has been observed in the atmospheres of Venus, Earth, Mars, Pluto, Titan, and Triton (e.g. Lécuyer et al. 2000; Scherf et al. 2020; Thelen et al. 2020; Benne et al. 2022; Glein 2023 and reference therein). Nitrogen molecules (HCN, HNC, HC3N, CH3CN, C2N2, C2H2CN, C2H5CN, and CH3C3CN) have also been detected in the atmosphere of Titan, the largest moon of Saturn (Niemann et al. 2010; Hörst 2017; Cordiner et al. 2019; Thelen et al. 2020), and in the atmosphere of the Earth (N2+, NO+, NO, NO2, NH3, HCN, and CH3CN) (Singh et al. 2003; Shiokawa et al. 2019; Mysen 2019; Lin & Ilie 2022). The species NH3 has been detected in Saturn and Jupiter (Hurley et al. 2012; Fletcher et al. 2014; Guillot et al. 2020). In addition, several nitrogen-containing species (N2+, CN+, NH2+, NH3+, NH4+, HCNH+, CN, NH2, HCN, HNC, HNCO, CH3CN, HC3N, and NH2CHO) have been observed in comets (Mumma & Charnley 2011; Shinnaka et al. 2014; Biver et al. 2015; Beth et al. 2020). Furthermore, N2 has been found in situ in comet 67P/C–G (Rubin et al. 2015). It has been suggested, based on a detected absorption band near 3.2 microns, that the nucleus of this comet may contain ammonium salts (Poch et al. 2020). Finally, large amounts of nitrogen compounds have been found in various classes of meteorites (Cronin & Pizzarello 1983; Grady & Wright 2003; Martins 2018).
The chemistry of the nitrogen- and phosphorus-bearing molecules in astrochemical sources remains poorly understood despite their importance. Observing and investigating the formation and destruction processes of N- and P-bearing species is particularly important due to their role in chemical networks and in forming biogenic compounds. Therefore, we studied the formation of the diphosphorus (P2+) and phosphorus mononitride (PN+) cations via radiative association (RA) processes in the elastic collisions of a phosphorus ion and a phosphorus atom, P+(3P) + P(4S), and a phosphorus ion and a nitrogen atom, P+(3P) + N(4S). PN+ and P2+ cations have not yet been observed in space. However, these cations can be formed by RA in astronomical sources where nitrogen atoms, phosphorus atoms, and phosphorus ions are available in the gas phase. In order to accurately describe the RA process of P2+ and PN+, we obtained potential energy curves (PECs) and transition dipole moments (TDMs) through high-level ab initio calculations, while RA was computed from cross-sections, which in turn were determined using a quantum mechanical method.
2 Method of calculation
2.1 Radiative association cross-sections
Perturbation theory for radiative coupling can be used to compute the quantum mechanical cross-section for the transition from the vibrational continuum of the upper state (Λ′) to the particular bound vibrational and rotational levels of the lower state (Λ″) (Stancil et al. 1993; Antipov et al. 2011). It is given by
![Mathematical equation: $\[\sigma_{\Lambda^{\prime} \rightarrow \Lambda^{\prime \prime}}(E)=\sum_{J^{\prime}, v^{\prime \prime} J^{\prime \prime}} \frac{64}{3} \frac{\pi^5}{4 \pi \varepsilon_0 k_i^2} \frac{f_{\Lambda^{\prime}}}{\lambda_{E \Lambda^{\prime \prime} S v^{\prime \prime} J^{\prime \prime}}^3} S_{J^{\prime} \Lambda^{\prime}, J^{\prime \prime} \Lambda^{\prime \prime}}\left|M_{\Lambda^{\prime} E J^{\prime}, \Lambda^{\prime \prime} \nu^{\prime \prime} J^{\prime \prime}}\right|^2,\]$](/articles/aa/full_html/2025/11/aa53590-24/aa53590-24-eq3.png) (1)
(1)
where the sum is over initial partial waves with angular momenta J′, final vibrational ν″, and rotational ![Mathematical equation: $\[J^{\prime \prime}; ~\mathrm{k}_{i}{=}\frac{\sqrt{2 \mu E}}{\hbar}\]$](/articles/aa/full_html/2025/11/aa53590-24/aa53590-24-eq4.png) is the wave number of the scattering state; μ is the reduced mass of the collision system; ε0 is the vacuum permittivity; λEΛ″Sv″J″ is the wavelength of the emitted photon; and SJ′Λ′,J″Λ″ is the Hönl-London factor, i.e. the dependence of spectroscopic line intensities on the rotational quantum numbers (Watson 2008). The SJ′Λ′,J″Λ″ in Eq. (1) is defined as
is the wave number of the scattering state; μ is the reduced mass of the collision system; ε0 is the vacuum permittivity; λEΛ″Sv″J″ is the wavelength of the emitted photon; and SJ′Λ′,J″Λ″ is the Hönl-London factor, i.e. the dependence of spectroscopic line intensities on the rotational quantum numbers (Watson 2008). The SJ′Λ′,J″Λ″ in Eq. (1) is defined as
![Mathematical equation: $\[S_{J^{\prime} \Lambda^{\prime}, J^{\prime \prime} \Lambda^{\prime \prime}}=\sum_{\Omega^{\prime \prime} \epsilon^{\prime \prime}} S_{J^{\prime} \Lambda^{\prime} S^{\prime} \Omega^{\prime} \epsilon^{\prime}, J^{\prime \prime} \Lambda^{\prime \prime} S^{\prime \prime} \Omega^{\prime \prime} \epsilon^{\prime \prime}}.\]$](/articles/aa/full_html/2025/11/aa53590-24/aa53590-24-eq5.png) (2)
(2)
The explicit definition of SJ′Λ′S′Ω′ϵ′,J″Λ″S″Ω″ϵ″ is provided by Watson (2008). In this work, we used the approximate values for doublets by shifting J′ by one-half in two of the factors in the numerator, following the procedure for doublet systems. This approximation is valid for large J′. The summation over Ω′ϵ′ of SJ′Λ′S′Ω′ϵ′,J″Λ″S″Ω″ϵ″ was implicitly done via multiplication by the factor fΛ′. The Hönl-London factors for the 2Δ →2 Π, 2Π →2 Σ±, 2Σ± →2 Π, and 2Π →2 Π transitions have been calculated in previous works via this method (Zámečníková et al. 2020; Gustafsson et al. 2012; Svensson et al. 2015). Therefore, the expressions used in this work are: ![Mathematical equation: $\[S_{J^{\prime}, J^{\prime}-1}=\frac{\left(J^{\prime}+1\right)}{2}, S_{J^{\prime}, J^{\prime}}= \frac{\left(2 J^{\prime}+1\right)}{2}\]$](/articles/aa/full_html/2025/11/aa53590-24/aa53590-24-eq6.png) , and
, and ![Mathematical equation: $\[S_{J^{\prime}, J^{\prime}+1}=\frac{J^{\prime}}{2}\]$](/articles/aa/full_html/2025/11/aa53590-24/aa53590-24-eq7.png) for the Π→Σ transitions;
for the Π→Σ transitions; ![Mathematical equation: $\[S_{J^{\prime}, J^{\prime}-1}=\frac{\left(J^{\prime}-1\right)}{2}\]$](/articles/aa/full_html/2025/11/aa53590-24/aa53590-24-eq8.png) ,
, ![Mathematical equation: $\[S_{J^{\prime}, J^{\prime}}=\frac{\left(2 J^{\prime}+1\right)}{2}\]$](/articles/aa/full_html/2025/11/aa53590-24/aa53590-24-eq9.png) , and
, and ![Mathematical equation: $\[S_{J^{\prime}, J^{\prime}+1}=\frac{\left(J^{\prime}+2\right)}{2}\]$](/articles/aa/full_html/2025/11/aa53590-24/aa53590-24-eq10.png) for the Σ→Π transitions; SJ′,J′−1=J′, SJ′,J′=0, and SJ′,J′+1=J′ for the Π→Π transitions; and SJ′,J′−1=J′ and SJ′,J′+1=J′ + 1 for the Σ→Σ transitions. This treatment neglects the explicit spin-dependent splitting of the rotational line strengths (Kovacs 1969). While such effects can influence individual line intensities, they are expected to have a minor impact on the averaged RA cross-sections and rate coefficients considered here. fΛ′ is the probability of approach in the upper molecular electronic state and is given by
for the Σ→Π transitions; SJ′,J′−1=J′, SJ′,J′=0, and SJ′,J′+1=J′ for the Π→Π transitions; and SJ′,J′−1=J′ and SJ′,J′+1=J′ + 1 for the Σ→Σ transitions. This treatment neglects the explicit spin-dependent splitting of the rotational line strengths (Kovacs 1969). While such effects can influence individual line intensities, they are expected to have a minor impact on the averaged RA cross-sections and rate coefficients considered here. fΛ′ is the probability of approach in the upper molecular electronic state and is given by
![Mathematical equation: $\[f_{\Lambda^{\prime}}=\frac{(2 S+1)\left(2-\delta_{0, \Lambda^{\prime}}\right)}{\left(2 L_A+1\right)\left(2 S_A+1\right)\left(2 L_B+1\right)\left(2 S_B+1\right)},\]$](/articles/aa/full_html/2025/11/aa53590-24/aa53590-24-eq11.png) (3)
(3)
where LA, SA, LB, and SB represent the electronic orbital and spin angular momenta of the A and B atoms, respectively. S is the spin quantum number of the electronic state Λ′. δ0,Λ′ is the Kronecker delta, which equals 1 if Λ′ = 0, and equals 0 otherwise.
The transition dipole matrix element MΛEJ′,Λ″ν″J″ is given by the integral
![Mathematical equation: $\[M_{\Lambda^{\prime} E J^{\prime}, \Lambda^{\prime \prime} \nu^{\prime \prime} J^{\prime \prime}}=\left\langle\Psi_{J^{\prime} E}^{\Lambda^{\prime}}(R)\right| D_{\Lambda^{\prime} \Lambda^{\prime \prime}}(R)\left|\Psi_{J^{\prime \prime} \nu^{\prime \prime}}^{\Lambda^{\prime \prime}}(R)\right\rangle_R.\]$](/articles/aa/full_html/2025/11/aa53590-24/aa53590-24-eq12.png) (4)
(4)
Here ![Mathematical equation: $\[\Psi_{J^{\prime} E}^{\Lambda^{\prime}}(R)\]$](/articles/aa/full_html/2025/11/aa53590-24/aa53590-24-eq13.png) is the continuous wave function of the initial state, E is the normalized energy, and
is the continuous wave function of the initial state, E is the normalized energy, and ![Mathematical equation: $\[\Psi_{J^{\prime \prime} \nu^{\prime \prime}}^{\Lambda^{\prime \prime}}(R)\]$](/articles/aa/full_html/2025/11/aa53590-24/aa53590-24-eq14.png) is the normalized bound state wave function. DΛ′Λ″(R) is an electric dipole TDM between Λ′ and Λ″. It is worth noting that in these calculations J is much greater than S, so the approximate values of the total angular momentum and spin are J − S ≈ J (Babb & Dalgarno 1995).
is the normalized bound state wave function. DΛ′Λ″(R) is an electric dipole TDM between Λ′ and Λ″. It is worth noting that in these calculations J is much greater than S, so the approximate values of the total angular momentum and spin are J − S ≈ J (Babb & Dalgarno 1995).
2.2 Rate coefficients
The thermal rate coefficients (in cm3 s−1) for the formation of a molecule by RA at a given temperature (T) were obtained by integrating the cross-section over a Maxwellian velocity distribution:
![Mathematical equation: $\[k_{\Lambda^{\prime} \rightarrow \Lambda^{\prime \prime}}(T)=\left(\frac{8}{\mu \pi}\right)^{1 / 2}\left(\frac{1}{k_B T}\right)^{3 / 2} \int_0^{\infty} E \sigma_{\Lambda^{\prime} \rightarrow \Lambda^{\prime \prime}}(E) e^{-E / k_B T} d E,\]$](/articles/aa/full_html/2025/11/aa53590-24/aa53590-24-eq15.png) (5)
(5)
where μ is the reduced mass of the system, kB is the Boltzmann constant, E is the collision energy, and σΛ′→Λ″(E) is the RA cross-section.
3 Results and discussion
3.1 The PECs and TDMs of the electronic states
Experimental studies on the electronic states of P2+ have been performed by Herzberg (1932), Narasimham (1957), Carroll & Mitchell (1975), Bulgin et al. (1976), Malicet et al. (1976), and Liu et al. (2024). However, theoretical studies on P2+ are scarce and mostly focus on the X2Πu ground state. Wang & Liu (2013) and Liu et al. (2024) provided a comprehensive theoretical calculation of P2+ spectroscopic constants.
Grein (1988), Zhu et al. (2016), Qin et al. (2019), and Liu et al. (2023) have investigated the electronic spectra of PN+ theoretically. Bulgin et al. (1977) constructed the PN+ PECs based on observed vibrational structures and the ionization potential (10.4868 eV) of phosphorus. Additionally, Wu & Fehlner (1975), Obase et al. (1981), Ahmad & Hamilton (1994), Bredohl et al. (1976), and Imajo et al. (2000) have conducted experimental studies on PN+ band spectra. We calculated the PECs and TDMs for both cations for this study.
All the high-level ab initio calculations of the PECs and TDMs needed for the cross-section RA calculus were performed in the MOLPRO 2012 program package (Werner et al. 2012). First, a single-configuration wave function of the ground state for PX+ (X=P, N) was computed using the Hartree-Fock calculation. Then, the multi-configuration wave function was obtained by optimizing the single-configuration wave function (Werner & Meyer 1980; Werner & Knowles 1985), using a state-averaged complete active space self-consistent field approach. Finally, a multi-reference configuration interaction method (MRCI+Q) with Davidson corrections was used to reduce the inaccuracy of the dimensional consistency and calculate the corresponding PECs and TDMs (Werner & Knowles 1988). The aug-cc-pwCV5Z-DK basis set was selected to describe P2+ considering the core-valence correlation and scalar relativistic effects. The aug-cc-pV5Z-DK basis set was selected to describe PN+. Scalar relativistic effects were taken into account by the third-order Douglas–Kall Hamiltonian approximation (Reiher & Wolf 2004) to calculate PECs and TDMs for the P2+ cation in the 2.27–26.46 bohr internuclear distances, and for the PN+ cation in the 1.89–26.46 bohr internuclear distances, as displayed in Figs. 1, 2, 3, and 4.
MOLPRO uses Abelian subgroups to calculate molecular properties. Accordingly, P2+ with D∞h symmetry was replaced by D2h symmetry. The D2h point group (Ag, Au, B1g, B2g, B3g, B1u, B2u, and B3u) holds an irreducible representation, and the corresponding relationships with the D∞h point group are as follows: σg → (ag, b1g), σu → (au, b1u), πg → (b2g, b3g), and πu → (b2u, b3u). For PN+, the C2v point-group symmetry was selected to calculate the C2v group, which has an irreducible representation of (A1, A2, B1, B2) corresponding to Σ+ = A1, Π = B1 + B2, Δ = A1 + A2, Σ− = A2, respectively. In this work, the 1s22s22p6 of the P+ ion, the 1s22s22p6 of the P atom, and the 1s2 of the N atom were added into the closed shell, and thus the molecular orbitals (2,1,1,0,2,1,1,0) and (4,2,2,0) were used as the active space of the P2+ cation and the PN+ cation, respectively. When calculating the P2+ cation, the 1s2 orbitals of the P+ ion and the P atom were placed into the core orbitals to save computational resources and achieve higher precision.
In this study, we only included RA processes where the reactants were in their ground states. Thus, there are 12 electronic states correlating to the lowest asymptote, P(4Su) + P+(3Pg), namely 2,4,6Πu, 2,4,6Σg+, 2,4,6Πg, and 2,4,6Σu+. There are also 6 electronic states that correlate with the first dissociation channel, N(4Su) + P+(3Pg), namely 2,4,6Σ+ and 2,4,6Π. In addition, we neglected electronic transitions from sextet states (repulsive states), which were expected to contribute little to the RA of P2+ and PN+ cations (Liu et al. 2023; Liu et al. 2024).
The PECs of the doublet and quartet electronic states of the P2+ and PN+ cations as a function of internuclear distance (R) are shown in Figs. 1 and 2, respectively. As seen in Fig. 1, the 14Πu and 14Σg+ states of P2+ exhibit a single barrier.
To check the accuracy of the PECs, we used the LEVEL program (Le Roy 2017) to calculate the spectroscopic constants of PX+ (X=P, N). For comparison, these constants are listed in Table 1, as are experimental and previous theoretical values.
For the X2Πu ground state of P2+, the errors of the Re, De, ωe, and Be values relative to the experimental results (Carroll & Mitchell 1975; Bulgin et al. 1976; Malicet et al. 1976; Huber & Herzberg 1980) are less than 0.8%, 2%, 2%, and 0.3%, respectively. In terms of the A2Σg+ state, the calculated Te value is 2126.0706 cm−1, which is in good agreement with the experimental results, with deviations of 46.07 cm−1 (Malicet et al. 1976), 53.24 cm−1 (Huber & Herzberg 1980), and 51.63 cm−1 (Reid 1994). In addition, the errors of Re, ωe, and Be values relative to the experimental data (Bulgin et al. 1977; Malicet et al. 1976; Huber & Herzberg 1980; Reid 1994) are less than 0.02% 3%, and 0.03%, respectively. For the 12Πg state, the calculated Te is 20421.682 cm−1, and the relative error between the calculated Te and the experimental value of 18 656 cm−1 (Malicet et al. 1976) is less than 10%. Additionally, the values of ωe, Be, and Re are in good agreement with experimental findings (Malicet et al. 1976), with deviations of 0.00016 cm−1, 0.0005 cm−1, and 0.0032 Å, respectively. For the 12Σu+ state, the Te value obtained here is 24 680.3325 cm−1, which is about 625 cm−1 smaller than the experimental value of 25 305 cm−1 (Malicet et al. 1976). Moreover, the difference between our values and experimental data (Malicet et al. 1976) for ωe and Re are 15.12 cm−1 and 0.0178 cm−1, respectively. For the 14Σu+ and 14Πg, the De are in reasonable agreement with the experimental values (Reid 1994). In addition, the relative errors between our calculated spectroscopic constants, Te, ωe, Be, and Re, for these states and the theoretical values are less than 2% (Liu et al. 2024). To the best of our knowledge, there are no corresponding experimental and theoretical spectroscopic constants on the 14Σg+ and 14Πu states of P2+.
For PN+ cations, the calculated ωe of the X2Σ+ ground state is 1309.1398 cm−1, which is in close agreement with recent experimental measurements of 1304.3 cm−1 (Ahmad & Hamilton 1994), 1306 cm−1 (Obase et al. 1983), and 1305 cm−1 (Obase et al. 1983). Additionally, our calculated De, Be, and Re values are also very close to experimental data, with small deviations of 0.032406 eV (Obase et al. 1983), 0.0139 cm−1 (Ahmad & Hamilton 1994), and 0.0113 Å (Obase et al. 1983), respectively. For the A2Π state, the Te value we computed is 3486.7966 cm−1, which is 99.2666 cm−1 greater than the experimental value of 3387.53 cm−1 (Bulgin et al. 1977), and the ωe value of 1140.0568 cm−1 is in good accordance with those determined experimentally (i.e. 1110±30 cm−1) by Bulgin et al. (1977). The calculated Re and De values are equal to 1.5622 Å and 4.584 eV, respectively, which differ from experimental values by 0.0028 Å and 1.15 eV (Bulgin et al. 1977). The relative errors between our computed spectroscopic constants (Te, ωe, Be, and Re) of a4Σ+ and b4Π states and the theoretical values are less than 2% (Liu et al. 2023). In addition, the calculated De values of the a4Σ+ and b4Π states are 0.17946 eV and 0.09988 eV, respectively, which are lower than the theoretical results (Liu et al. 2023). These differences arise mainly due to the different basis sets used in the calculations. In general, our spectroscopic constant values for PN+ and P2+ cations are in good agreement with the experimental and theoretical results. This confirms the accuracy of our PECs.
To calculate the cross-sections and rate coefficients of PX+ (X=P, N) RA, the PECs and TDMs must be extrapolated over the short range and the long range of the internuclear distance (R). In this work, for the R < 2.27 bohr of P2+ and the R < 1.89 bohr of PN+, PECs were extrapolated using the following function:
![Mathematical equation: $\[V(R)=A ~\exp (-B R)+C,\]$](/articles/aa/full_html/2025/11/aa53590-24/aa53590-24-eq16.png) (6)
(6)
where A, B, and C are fitting parameters (shown in Table 2). As an example, for PN+, the dotted line in Fig. 2 shows the results obtained from the fit using Eq. (6). It can be seen that the fitted short-range potential is continuous with the ab initio values at the connection region. A similar consistency holds for ![Mathematical equation: $\[\mathrm{P}_2^{+}\]$](/articles/aa/full_html/2025/11/aa53590-24/aa53590-24-eq17.png) .
.
For R > 26.46 bohr, the PECs were extrapolated using the following equation:
![Mathematical equation: $\[V(R)=\frac{C_3}{R^3}-\frac{\alpha_d}{2 R^4},\]$](/articles/aa/full_html/2025/11/aa53590-24/aa53590-24-eq18.png) (7)
(7)
where ![Mathematical equation: $\[\frac{C_{3}}{R^{3}}\]$](/articles/aa/full_html/2025/11/aa53590-24/aa53590-24-eq19.png) is the charge-atomic-quadrupole interaction potential energy (Gentry & Giese 1977), and αd is the electrostatic dipole polarizability of the phosphorus atom for each state (Molof et al. 1974; Zeiss & Meath 1977; Schwerdtfeger & Nagle 2018). Here, we used the αd (P) =30 (atomic units) and αd (N) =7.3 (atomic units) recommended by Shevelko & Vinogradov (1979). The value of C3 was obtained by fitting the ab initio energy point while keeping αd fixed. The C3 values of the P2+ and PN+ cations are shown in Table 2.
is the charge-atomic-quadrupole interaction potential energy (Gentry & Giese 1977), and αd is the electrostatic dipole polarizability of the phosphorus atom for each state (Molof et al. 1974; Zeiss & Meath 1977; Schwerdtfeger & Nagle 2018). Here, we used the αd (P) =30 (atomic units) and αd (N) =7.3 (atomic units) recommended by Shevelko & Vinogradov (1979). The value of C3 was obtained by fitting the ab initio energy point while keeping αd fixed. The C3 values of the P2+ and PN+ cations are shown in Table 2.
Our calculated TDM values as a function of the internuclear distance (R) for the A2Π→X2Σ+ and b4Π→a4Σ+ electronic transitions of the PN+ cation, and for the A2Σg+→X2Πu, 12Σu+→12Πg, and 14Σu+→a4Πg electronic transitions of the P2+ cation, are shown in Fig. 3. Similarly, the TDM values for 12Πg→X2Πu, 12Σu+→12Σg+, 14Πu→14Πg, and 14Σg+→14Σu+ systems of the P2+ cation are shown in Fig. 4. Our TDM results for the A2Π→X2Σ+ and b4Π→a4Σ+ system of PN+ appear to be comparable with those obtained by Qin et al. (2019) except at short internuclear distances, where our TDM values are slightly smaller than theirs. Our TDM curves for P2+ are also in satisfactory agreement with the ones reported by Liu et al. (2024). The deviations may result from the different levels of theory used in the calculations.
The TDM values approach zero for large R (Fig. 3). Therefore, the TDMs were fitted to the form 1/R4 for R > 26.46 bohr, except for the 12Πg → X2Πu, 12Σu+ → 12Σg+, 14Πu → 14Πg, and 14Σg+ → 14Σu+ electronic transitions of P2+ (Fig. 4), which were fitted to −0.22+0.5R for R > 11.34 bohr. For example, when R=12 bohr, the fitted expression gives the TDM value of −0.22+0.5×12 = 5.78 a.u., which is consistent with the calculated data. This situation is similar to the TDM of A2Πu → X2Πg transition for O2+ (Wetmore et al. 1984), as well as the TDMs of the B4Σu → X4Σg−, f2Πg → a2Πu, and 22Πg → 22Πu systems of C2+ (Babb et al. 2019) and the Σg+ → Σu+ and Πu → Πg transitions of N2+ (Qin et al. 2021).
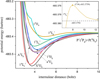 |
Fig. 1 PECs of the P2+ cation. |
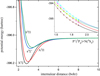 |
Fig. 2 PEC s of the PN+ cation. |
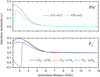 |
Fig. 3 TDMs of the P2+ and PN+ cations. |
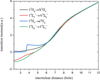 |
Fig. 4 TDMs of the P2+ cation. |
Spectroscopic constants of the bound states of the P2+ and PN+ cations.
A, B, C, and C3 (atomic units) of the P2+ and PN+ cations.
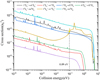 |
Fig. 5 Cross-sections of the P2+ cation. |
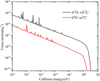 |
Fig. 6 Cross-sections of the PN+ cation. |
3.2 Radiative association cross-sections
Radiative association cross-sections for A2Σg+→X2Πu, 12Σu+→12Πg, 12Σu+→A2Σg+, 12Πg→X2Πu, 14Σg+→14Σu+, 14Σu+→a4Πg, and 14Πu→a4Πg electronic transitions of the P2+ cation were evaluated using the quantum mechanical method described above. The results are given in Fig. 5. Additionally, the RA cross-sections of the A2Π→X2Σ+ and b4Π→a4Σ+ transitions of the PN+ cation were obtained using the same method, and their results are presented in Fig. 6.
3.2.1 P2+ cation
As can be seen from Fig. 5, the 14Πu→a4Πg electronic transition shows the largest RA cross-sections over the entire range of collision energy under consideration. The sizes of the cross-sections of this transition decrease gradually with the increase in collision energy. In addition, when the collision energy increases to 3 eV, the sizes of the cross-sections decrease sharply under the influence of the Franck-Condon principle. In particular, the cross-sections reveal the presence of many resonances at the low impact energy, but with the increase in the collision energy, resonance gradually decreases. The trend of the 12Σu+→A2Σg+ and 12Πg→X2Πu cross-sections is similar, at least qualitatively, to that for the 14Πu→a4Πg transition during the whole process. However, their cross-sections are about one order of magnitude smaller than those for the 14Πu→a4Πg transition and do not contribute significantly to the total association cross-section. The sizes of the cross-sections for the 14Σg+→14Σu+ transition also decrease monotonically as the collision energy increases up to 0.01 eV. Above this energy, the cross-section sizes increase rapidly due to the 0.09 eV (−683.3759+683.3792≈0.0033 hartree) potential barrier at R = 7.94 bohr on the 14Σg+ electronic state. It is worth noting that the cross-sections of the 14Σg+→14Σu+ electronic transition have some resonances at low energy levels. In the relatively high-energy collision region (around 0.09 eV), shape resonances are evident, which are caused by the quasi-bound state supported by the PEC of the 14Σg+ state with a potential barrier of 0.09 eV at R = 7.94 bohr. With the increase in collision energy, the tunneling velocity decreases, resulting in the disappearance of resonances. The trend of the A2Σg+→X2Πu, 12Σu+→12Πg, and 14Σu+→a4Πg cross-section curves and resonances is the same as that for the 14Πu→a4Πg transition. However, their cross-section values are several orders of magnitude lower than those for the 14Πu→a4Πg transition and thus have an insignificant effect on the whole radiative collision process.
3.2.2 PN+ cation
It can be seen from Fig. 6 that the A2Π→X2Σ+ transition plays a major role in the RA process of the PN+ cation, formed by the collision between a P+ ion and an N atom. The corresponding cross-section of the b4Π→a4Σ+ transition is one order of magnitude smaller and does not contribute significantly to the total association cross-section. In the Franck–Condon region, the overlap between the continuum wave functions of the A2Π state and the bound vibrational functions of the X2Σ+ ground state is the largest. In both radiative collision processes, the resonances are evident and gradually decrease with the increase in the collision energy. In the high energy region, due to the Franck-Condon principle, the cross-sections drop sharply.
3.3 Rate coefficients
Radiative association rate coefficients for the doublet and quartet electronic transition of PX+ (X=P, N), computed from the cross-sections, are shown in Figs. 7 and 8. The temperature ranges considered are 10–7000 K for P2+ and 10–5000 K for PN+. The values of the total rate coefficients are provided in Table 3. For the P2+ cation, as expected from the cross-section results, the 14Πu→a4Πg electronic transition is the most efficient. This transition exceeds the other rate coefficients by about one order of magnitude over almost the entire temperature range. In addition, the 14Σg+→14Σu+ rate coefficients are small at low energies due to the influence of the barrier height, and with the increase in temperature, they exceed the 12Σu+→12Πg, 12Σu+→A2Σg+, and 12Πg→X2Πu transitions rate coefficients and contribute little to RA at high temperatures. The obtained total rate coefficient for the formation of P2+ by RA increases slowly at first and then decreases slowly with the increase in temperature from 10 to 7000 K, and its maximum value is about 1.66×10⁻¹⁶ cm3 s−1 at 3500–6000 K. In turn, the total rate coefficient for the formation of PN+ by RA decreases from about 3.12×10⁻¹⁹ cm3 s−1 at 10 K to about 2.70×10⁻¹⁹ cm3 s−1 at 5000 K.
The total RA rate constant of the P2+ cation is approximately one to three orders of magnitude higher than that of the PN+, PH+ (Chen et al. 2024b), and PCl+ cations (Chen et al. 2024a), but in general it is still much lower than the rate coefficients for the formation of diatomic molecules through other reaction types (e.g. Millar et al. 2024). However, RA is the main route for molecule formation in astrophysical environments, such as Wolf-Rayet winds and the ejecta of supernovae and novae, where the density is too low to allow for the more common three-body association reaction, grains still have to be formed, and hydrogen is absent (e.g. Ono et al. 2024 and references therein).
For incorporation into astrochemical reaction databases, the calculated total rate coefficient was fitted with the three-parameter Arrhenius-Kooij function:
![Mathematical equation: $\[k(T)=A\left(\frac{T}{300}\right)^\alpha e^{-\beta / T},\]$](/articles/aa/full_html/2025/11/aa53590-24/aa53590-24-eq20.png) (8)
(8)
where A, α, and β are fitting parameters and k(T) is in cm3 s−1. In order to fit more accurately, the total rate coefficient curves were classified into seven temperature ranges, and the fitting parameters are shown in Table 4.
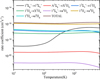 |
Fig. 7 Rate coefficients of the P2+ cation. |
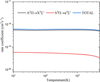 |
Fig. 8 Rate coefficients of the PN+ cation. |
RA rate coefficients of the P2+ and PN+ cation.
Fitting parameters of the P2+ and PN+ cation.
4 Summary
In this study we estimated the cross-sections and rate coefficients for the RA of P(4S) atoms, N(4S) atoms, and the P+(3P) ion to form P2+ and PN+, using a quantum mechanical approach. The PECs and TDMs needed for the RA cross-section calculus were obtained by employing the MRCI+Q method with aug-cc-pwCV5Z-DK and aug-cc-pV5Z-DK basis sets for P2+ and PN+ cations, respectively. We find that the 14Πu→a4Πg and A2Π→X2Σ+ electronic transitions for P2+ and PN+, respectively, are the dominant cation-forming transitions in the entire temperature range. The total rate coefficient for the formation of P2+ by RA increases at first and then decreases with the increase in temperature from 10 to 7000 K, and its maximum value is 1.66×10⁻¹⁶ cm3 s−1 at 3500–6000 K. In turn, the total rate coefficient for the formation of PN+ by RA decreases from about 3.12×10⁻¹⁹ cm3 s−1 at 10 K to about 2.70×10⁻¹⁹ cm3 s−1 at 7000 K. The RA process forms the P2+ cation faster than the PN+ cation. However, their formations in astronomical sources depend on the relative concentration of P+ ions and N and P atoms in the gas phase. We expect that the computed rate constants will be useful in the investigation of the chemical evolution of N- and P-bearing molecules and dust formation in a relatively low-density and hot gaseous astronomical environment.
Data availability
The dataset containing the calculated RA cross-sections is available at Zenodo: https://doi.org/10.5281/zenodo.17222725.
Acknowledgements
This work was supported by the National Natural Science Foundation of China (Grant Nos. 12274178, 11874177); The High Performance Computing Center (HPCC) of Jilin University and the high-performance computing cluster Tiger@ IAMP. Finally, would also like to thank Professors Yong Wu and Jianguo Wang for their help.
References
- Agúndez, M., Cernicharo, J., & Guélin, M. 2007, ApJ, 662, L91 [CrossRef] [Google Scholar]
- Agúndez, M., Cernicharo, J., Decin, L., Encrenaz, P., & Teyssier, D. 2014a, ApJ, 790, L27 [CrossRef] [Google Scholar]
- Agúndez, M., Cernicharo, J., & Guélin, M. 2014b, A&A, 570, A45 [Google Scholar]
- Ahmad, I., & Hamilton, P. 1994, J. Mol. Spectrosc., 163, 214 [Google Scholar]
- Altwegg, K., Balsiger, H., Bar-Nun, A., et al. 2016, Sci. Adv., 2, e1600285 [NASA ADS] [CrossRef] [Google Scholar]
- Antipov, S. V., Gustafsson, M., & Nyman, G. 2011, J. Chem. Phys., 135, 184302 [NASA ADS] [CrossRef] [Google Scholar]
- Babb, J. F., & Dalgarno, A. 1995, Phys. Rev. A, 51, 3021 [NASA ADS] [CrossRef] [Google Scholar]
- Babb, J. F., Smyth, R. T., & McLaughlin, B. M. 2019, ApJ, 876, 38 [Google Scholar]
- Benne, B., Dobrijevic, M., Cavalié, T., Loison, J.-C., & Hickson, K. M. 2022, A&A, 669, A169 [Google Scholar]
- Beth, A., Altwegg, K., Balsiger, H., et al. 2020, A&A, 642, A27 [NASA ADS] [CrossRef] [EDP Sciences] [Google Scholar]
- Biver, N., Bockelée-Morvan, D., Moreno, R., et al. 2015, Sci. Adv., 1, 1500863 [NASA ADS] [CrossRef] [Google Scholar]
- Bredohl, H., Dubois, I., Houbrechts, Y., & Singh, M. 1976, CJP, 54, 680 [Google Scholar]
- Bregman, J. D., Lester, D. F., & Rank, D. M. 1975, ApJ, 202, L55 [NASA ADS] [CrossRef] [Google Scholar]
- Bulgin, D. K., Dyke, J. M., & Morris, A. 1976, J. Chem. Soc., 72, 2225 [Google Scholar]
- Bulgin, D. K., Dyke, J. M., & Morris, A. 1977, J. Chem. Soc., 73, 983 [Google Scholar]
- Caffau, E., Andrievsky, S., Korotin, S., et al. 2016, A&A, 585, A16 [NASA ADS] [CrossRef] [EDP Sciences] [Google Scholar]
- Carroll, P. K., & Mitchell, P. I. 1975, Proc. R. Soc. Lond. A., 342, 93 [Google Scholar]
- Cernicharo, J., Guélin, M., & Kahane, C. 2000, A&AS, 142, 181 [NASA ADS] [CrossRef] [EDP Sciences] [Google Scholar]
- Chen, Y., Lin, X., Xiao, L., et al. 2024a, MNRAS, 533, 3246 [Google Scholar]
- Chen, Y., Lin, X., Xiao, L., et al. 2024b, Front. Astron. Space Sci., 11, 1335464 [Google Scholar]
- Chin, Y.-n., Henkel, C., Langer, N., & Mauersberger, R. 1999, ApJ, 512, L143 [NASA ADS] [CrossRef] [Google Scholar]
- Cordiner, M., Teanby, N. A., Thelen, A. E., et al. 2019, 76, ApJ, 158, 76 [Google Scholar]
- Cronin, J. R., & Pizzarello, S. 1983, ASR, 3, 5 [Google Scholar]
- Fletcher, L. N., Greathouse, T. K., Orton, G. S., et al. 2014, Icarus, 238, 170 [NASA ADS] [CrossRef] [Google Scholar]
- Flynn, G. J., Bleuet, P., Borg, J., et al. 2006, Sci., 314, 1731 [Google Scholar]
- Gardner, E., Lehto, H. J., Lehto, K., et al. 2020, MNRAS, 499, 1870 [Google Scholar]
- Gentry, W. R., & Giese, C. F. 1977, J. Chem. Phys., 67, 2355 [Google Scholar]
- Glein, C. R. 2023, Icarus, 404, 115651 [Google Scholar]
- Grady, M. M., & Wright, I. P. 2003, Space Sci. Rev., 16, 231 [Google Scholar]
- Grein, F. 1988, Chem Phys., 120, 383 [Google Scholar]
- Guelin, M., Cernicharo, J., Paubert, G., & Turner, B. E. 1990, A&A, 239, L9 [Google Scholar]
- Guillot, T., Li, C., Bolton, S. J., et al. 2020, J. Geophys. Res. Planet., 125, e06404 [Google Scholar]
- Gustafsson, M., Antipov, S. V., Franz, J., & Nyman, G. 2012, J. Chem. Phys., 137, 104301 [NASA ADS] [CrossRef] [Google Scholar]
- Haasler, D., Rivilla, V. M., Martín, S., et al. 2022, A&A, 659, A158 [CrossRef] [EDP Sciences] [Google Scholar]
- Halfen, D. T., Clouthier, D. J., & Ziurys, L. M. 2008, ApJ, 677, L101 [NASA ADS] [CrossRef] [Google Scholar]
- Herzberg, G. 1932, AdP, 407, 677 [Google Scholar]
- Hinkel, N. R., Hartnett, H. E., & Young, P. A. 2020, ApJ, 900, L38 [NASA ADS] [CrossRef] [Google Scholar]
- Hörst, S. M. 2017, J. Geophys. Res. Planet., 122, 432 [Google Scholar]
- Huber, K. P., & Herzberg, G. 1980, J. Mol. Struct., 64, 299 [Google Scholar]
- Hurley, J., Fletcher, L. N., Irwin, P. G. J., et al. 2012, Planet. Space Sci., 73, 347 [Google Scholar]
- Imajo, T., Tokieda, K., Nakashima, Y., Tanaka, K., & Tanaka, T. 2000, J. Mol. Spectrosc., 204, 21 [Google Scholar]
- Imajo, T., Tokieda, K., Nakashima, Y., Tanaka, K., & Tanaka, T. 2000, J. Mol. Spectrosc., 204, 21 [Google Scholar]
- Jura, M., & York, D. G. 1978, ApJ, 219, 861 [NASA ADS] [CrossRef] [Google Scholar]
- Kissel, J., & Krueger, F. R. 1987, Nature, 328, 117 [Google Scholar]
- Koelemay, L. A., Burton, M. A., Singh, A. P., et al. 2022, ApJ, 940, L11 [Google Scholar]
- Koelemay, L. A., Gold, K. R., & Ziurys, L. M. 2023, Nature, 623, 292 [Google Scholar]
- Koo, B.-C., Lee, Y.-H., Moon, D.-S., Yoon, S.-C., & Raymond, J. C. 2013, Science, 342, 1346 [NASA ADS] [CrossRef] [Google Scholar]
- Kovacs, I. 1969, Rotational structure in the spectra of diatomic molecules (London (UK): Adam Hilger) [Google Scholar]
- Larson, H. P., Treffers, R. R., & Fink, U. 1977, ApJ, 211, 972 [NASA ADS] [CrossRef] [Google Scholar]
- Le Roy, R. J. 2017, J. Quant. Spec. Radiat. Transf., 186, 167 [Google Scholar]
- Lebouteiller, V., Kuassivi, & Ferlet, R. 2005, A&A, 443, 509 [NASA ADS] [CrossRef] [EDP Sciences] [Google Scholar]
- Lécuyer, C., Simon, L., & Guyot, F. 2000, Earth. Planet. Sci. Lett., 181, 33 [Google Scholar]
- Lefloch, B., Vastel, C., Viti, S., et al. 2016, MNRAS, 462, 3937 [CrossRef] [Google Scholar]
- Lewis, J. A., & Jones, R. H. 2016, Meteorit Planet Sci., 51, 1886 [Google Scholar]
- Lin, M.-Y., & Ilie, R. 2022, Front. Astronomy Space Sci., 8, 223 [Google Scholar]
- Liu, H., Gao, H., & Zhu, Z. 2023, Comput Theor Chem., 1230, 114380 [Google Scholar]
- Liu, H., Zhu, Z., & Shi, D. 2024, Mol. Phys., 123, e2418312 [Google Scholar]
- Maas, Z. G., Pilachowski, C. A., & Cescutti, G. 2017, ApJ, 841, 108 [NASA ADS] [CrossRef] [Google Scholar]
- Malicet, J., Brion, J., & Guenebaut, H. 1976, CJP, 54, 907 [Google Scholar]
- Martín, S., Mauersberger, R., Martín-Pintado, J., García-Burillo, S., & Henkel, C. 2003, A&A, 411, L465 [NASA ADS] [CrossRef] [EDP Sciences] [Google Scholar]
- Martins, Z. 2018, Life, 8, 28 [Google Scholar]
- Meyer, D. M., Cardelli, J. A., & Sofia, U. J. 1997, ApJ, 490, L103 [NASA ADS] [CrossRef] [Google Scholar]
- Millar, T. J., Walsh, C., Van de Sande, M., & Markwick, A. J. 2024, A&A, 682, A109 [NASA ADS] [CrossRef] [EDP Sciences] [Google Scholar]
- Molaro, P., Levshakov, S. A., D’Odorico, S., Bonifacio, P., & Centurión, M. 2001, ApJ, 549, 90 [NASA ADS] [CrossRef] [Google Scholar]
- Molof, R. W., Schwartz, H. L., Miller, T. M., & Bederson, B. B. 1974, Phys. Rev. A, 10, 1131 [Google Scholar]
- Mumma, M. J., & Charnley, S. B. 2011, ARA&A, 49, 471 [NASA ADS] [CrossRef] [Google Scholar]
- Mysen, B. 2019, Prog Earth Planet Sci., 6, 38 [Google Scholar]
- Narasimham, N. A. 1957, CJP, 35, 1242 [Google Scholar]
- Niemann, H. B. O., Atreya, S. K., Demick, J. E., et al. 2010, J. Geophys. Res. Planet., 115, E12006 [Google Scholar]
- Obase, H., Tsuji, M., & Nishimura, Y. 1981, Chem. Phys. Lett., 81, 119 [Google Scholar]
- Obase, H., Tsuji, M., & Nishimura, Y. 1983, Chem Phys., 74, 89 [Google Scholar]
- Ono, M., Nozawa, T., Nagataki, S., et al. 2024, ApJS, 271, 33 [Google Scholar]
- Otsuka, M., Meixner, M., Riebel, D., et al. 2011, ApJ, 729, 39 [NASA ADS] [CrossRef] [Google Scholar]
- Persson, C. M., Gerin, M., Mookerjea, B., et al. 2014, A&A, 568, A37 [NASA ADS] [CrossRef] [EDP Sciences] [Google Scholar]
- Poch, O., Istiqomah, I., Quirico, E., et al. 2020, Science, 367, aaw7462 [NASA ADS] [CrossRef] [Google Scholar]
- Qin, Z., Zhao, J. M., & Liu, L. H. 2019, J. Quant. Spec. Radiat. Transf., 233, 110 [Google Scholar]
- Qin, Z., Bai, T., & Liu, L. 2021, MNRAS, 507, 2930 [NASA ADS] [CrossRef] [Google Scholar]
- Reid, C. J. 1994, Chem. Phys. Lett., 229, 279 [Google Scholar]
- Reiher, M., & Wolf, A. 2004, J. Chem. Phys., 121, 2037 [Google Scholar]
- Rivilla, V. M., Fontani, F., Beltrán, M. T., et al. 2016, ApJ, 826, 161 [CrossRef] [Google Scholar]
- Rivilla, V. M., Drozdovskaya, M. N., Altwegg, K., et al. 2020, MNRAS, 492, 1180 [Google Scholar]
- Rivilla, V. M., García De La Concepción, J., Jiménez-Serra, I., et al. 2022, Front. Astron. Space Sci., 9, 829288 [NASA ADS] [CrossRef] [Google Scholar]
- Rubin, M., Altwegg, K., Balsiger, H., et al. 2015, Science, 348, 232 [NASA ADS] [CrossRef] [Google Scholar]
- Scherf, M., Lammer, H., Erkaev, N. V., et al. 2020, Space Sci. Rev., 216, 123 [Google Scholar]
- Schwerdtfeger, P., & Nagle, J. K. 2018, Mol. Phys., 117, 1200 [Google Scholar]
- Shevelko, V. P., & Vinogradov, A. 1979, Phys. Scr., 19, 275 [Google Scholar]
- Shinnaka, Y., Kawakita, H., Kobayashi, H., Nagashima, M., & Boice, D. C. 2014, ApJ, 782, L16 [NASA ADS] [CrossRef] [Google Scholar]
- Shiokawa, K., Otsuka, Y., & Connors, M. 2019, J. Geophys. Res. Space Phys., 124, 9293 [Google Scholar]
- Singh, H. B., Salas, L., Herlth, D., et al. 2003, J. Geophys. Res. Atmos, 108, 8795 [Google Scholar]
- Sousa-Silva, C., Seager, S., Ranjan, S., et al. 2020, Astrobiology, 20, 235 [Google Scholar]
- Stancil, P. C., Babb, J. F., & Dalgarno, A. 1993, ApJ, 414, 672 [NASA ADS] [CrossRef] [Google Scholar]
- Svensson, S. K.-M., Gustafsson, M., & Nyman, G. 2015, J. Phys. Chem. A, 119, 12263 [Google Scholar]
- Tenenbaum, E. D., Woolf, N. J., & Ziurys, L. M. 2007, ApJ, 666, L29 [NASA ADS] [CrossRef] [Google Scholar]
- Thelen, A. E., Cordiner, M. A., Nixon, C. A., et al. 2020, ApJ, 903, L22 [Google Scholar]
- Turner, B. E., & Bally, J. 1987, ApJ, 321, L75 [NASA ADS] [CrossRef] [Google Scholar]
- Wang, J.-M., & Liu, Q. 2013, Chin. Phys. B., 22, 093102 [Google Scholar]
- Watson, J. K. G. 2008, J. Mol. Spectrosc., 252, 5 [NASA ADS] [CrossRef] [Google Scholar]
- Wedig, U., Stoll, H., & Preuss, H. 1981, Chem. Phys., 61, 117 [Google Scholar]
- Werner, H.-J., & Meyer, W. 1980, J. Chem. Phys., 73, 2342 [Google Scholar]
- Werner, H.-J., & Knowles, P. J. 1985, J. Chem. Phys., 82, 5053 [NASA ADS] [CrossRef] [Google Scholar]
- Werner, H.-J., & Knowles, P. J. 1988, J. Chem. Phys., 89, 5803 [NASA ADS] [CrossRef] [Google Scholar]
- Werner, H.-J., Knowles, P. J., Knizia, G., Manby, F. R., & Schütz, M. 2012, Wires Comput. Mol. Sci., 2, 242 [Google Scholar]
- Wetmore, R. W., Fox, J. L., & Dalgarno, A. 1984, Planet Space Sci., 32, 1111 [Google Scholar]
- Wu, M., & Fehlner, T. 1975, Chem. Phys. Lett., 36, 114 [Google Scholar]
- York, D. G., Spitzer, L., Bohlin, R. C., et al. 1983, ApJ, 266, L55 [NASA ADS] [CrossRef] [Google Scholar]
- Zámečníková, M., Gustafsson, M., Nyman, G., & Soldán, P. 2020, MNRAS, 492, 3794 [CrossRef] [Google Scholar]
- Zeiss, G., & Meath, W. J. 1977, Mol Phys., 33, 1155 [Google Scholar]
- Zhu, Z., Zhou, D., Wang, X., Shi, D., & Sun, J. 2016, Comput. Theor. Chem., 1079, 23 [Google Scholar]
- Ziurys, L. M. 1987, ApJ, 321, L81 [NASA ADS] [CrossRef] [Google Scholar]
All Tables
All Figures
|
Fig. 1 PECs of the P2+ cation. |
| In the text | |
|
Fig. 2 PEC s of the PN+ cation. |
| In the text | |
|
Fig. 3 TDMs of the P2+ and PN+ cations. |
| In the text | |
|
Fig. 4 TDMs of the P2+ cation. |
| In the text | |
|
Fig. 5 Cross-sections of the P2+ cation. |
| In the text | |
|
Fig. 6 Cross-sections of the PN+ cation. |
| In the text | |
|
Fig. 7 Rate coefficients of the P2+ cation. |
| In the text | |
|
Fig. 8 Rate coefficients of the PN+ cation. |
| In the text | |
Current usage metrics show cumulative count of Article Views (full-text article views including HTML views, PDF and ePub downloads, according to the available data) and Abstracts Views on Vision4Press platform.
Data correspond to usage on the plateform after 2015. The current usage metrics is available 48-96 hours after online publication and is updated daily on week days.
Initial download of the metrics may take a while.