Open Access
Fig. 13.
Download original image
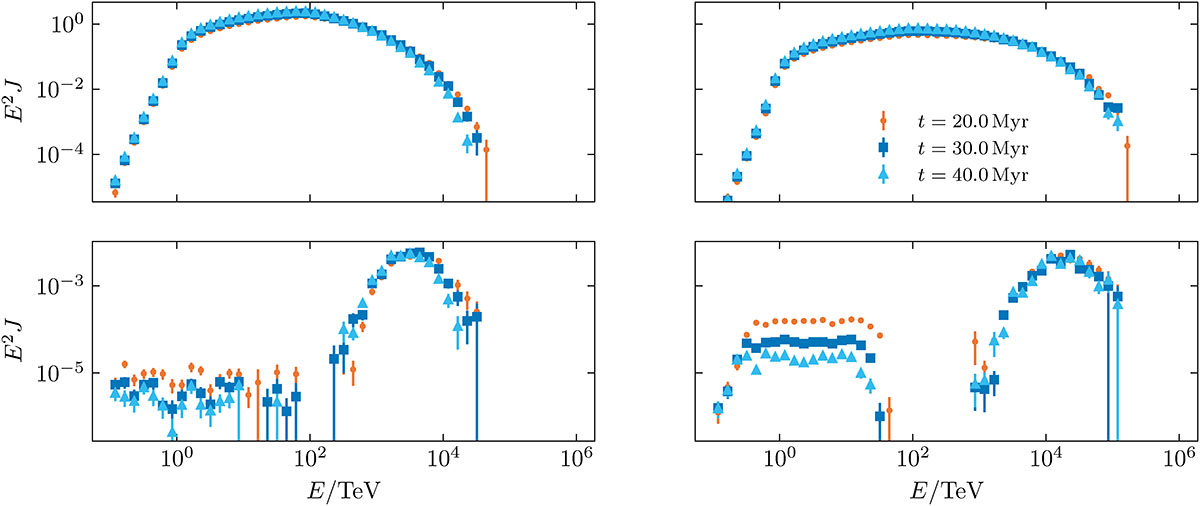
Energy spectra over time at the moving shocks (top) and downstream (bottom) at 5 kpc at for E0 = 100 ESN, B0 = 10 μG (left) and E0 = 10 ESN, and B0 = 100 μG (right).
Current usage metrics show cumulative count of Article Views (full-text article views including HTML views, PDF and ePub downloads, according to the available data) and Abstracts Views on Vision4Press platform.
Data correspond to usage on the plateform after 2015. The current usage metrics is available 48-96 hours after online publication and is updated daily on week days.
Initial download of the metrics may take a while.