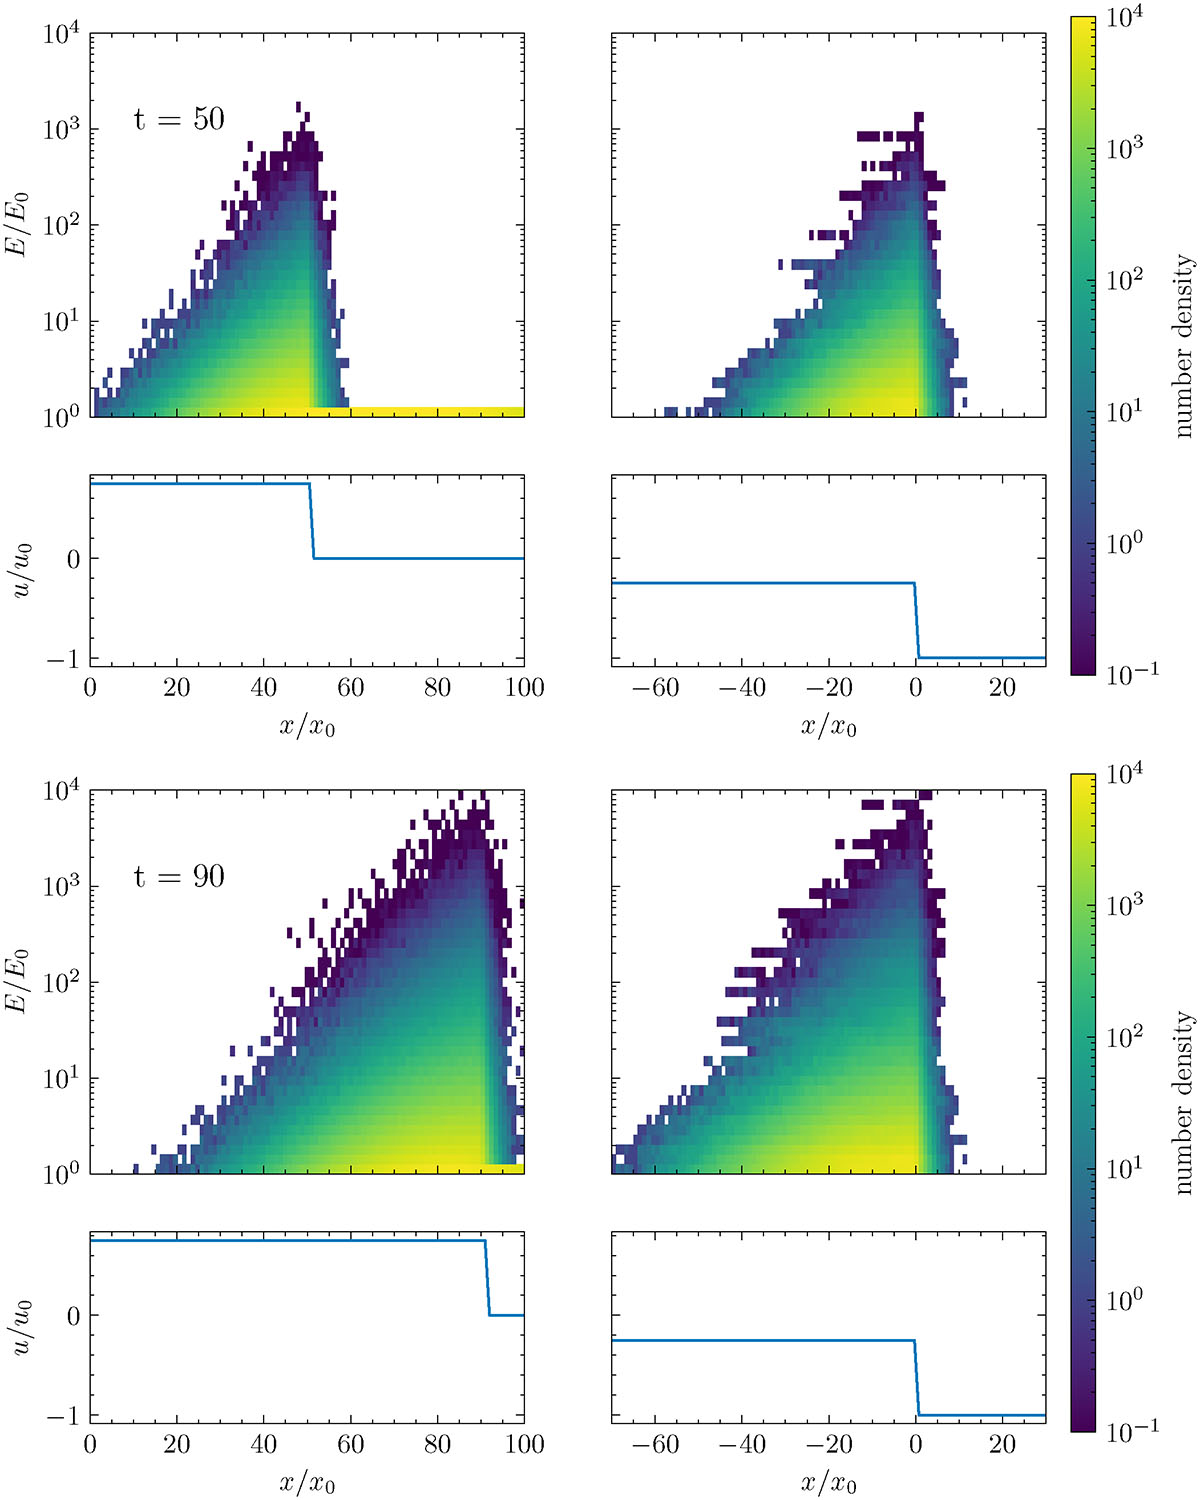
Fig. 2.
Download original image
Left: Wind profiles and space-energy histogram in the lab frame. Pseudo-particles are injected in the undisturbed medium, the shock is moving through it. Right: Stationary wind profile and space-energy histogram. Pseudo-particles are injected at the shock. For both columns, the top row shows spectra and wind profiles at T = 50 and the bottom row shows them at T = 90.
Current usage metrics show cumulative count of Article Views (full-text article views including HTML views, PDF and ePub downloads, according to the available data) and Abstracts Views on Vision4Press platform.
Data correspond to usage on the plateform after 2015. The current usage metrics is available 48-96 hours after online publication and is updated daily on week days.
Initial download of the metrics may take a while.