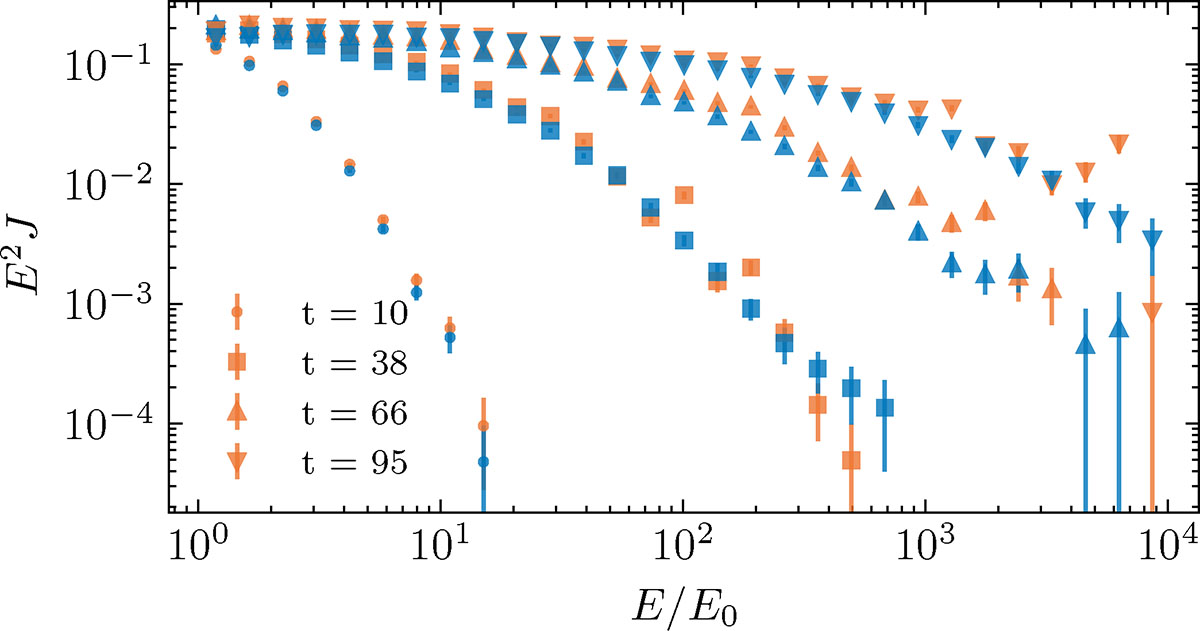
Fig. 3.
Download original image
Energy spectra at the shocks in the lab frame (moving with the shock) (blue) and in the stationary shock frame (orange). The resulting spectral slope and time evolution are the same. Error bars are obtained from the Monte Carlo error in each bin and proportional to ![]() , where N is the number of independent candidates in the respective bin. The discrepancy mainly is due to the time integration in the case of the stationary profile.
, where N is the number of independent candidates in the respective bin. The discrepancy mainly is due to the time integration in the case of the stationary profile.
Current usage metrics show cumulative count of Article Views (full-text article views including HTML views, PDF and ePub downloads, according to the available data) and Abstracts Views on Vision4Press platform.
Data correspond to usage on the plateform after 2015. The current usage metrics is available 48-96 hours after online publication and is updated daily on week days.
Initial download of the metrics may take a while.