Fig. 4.
Download original image
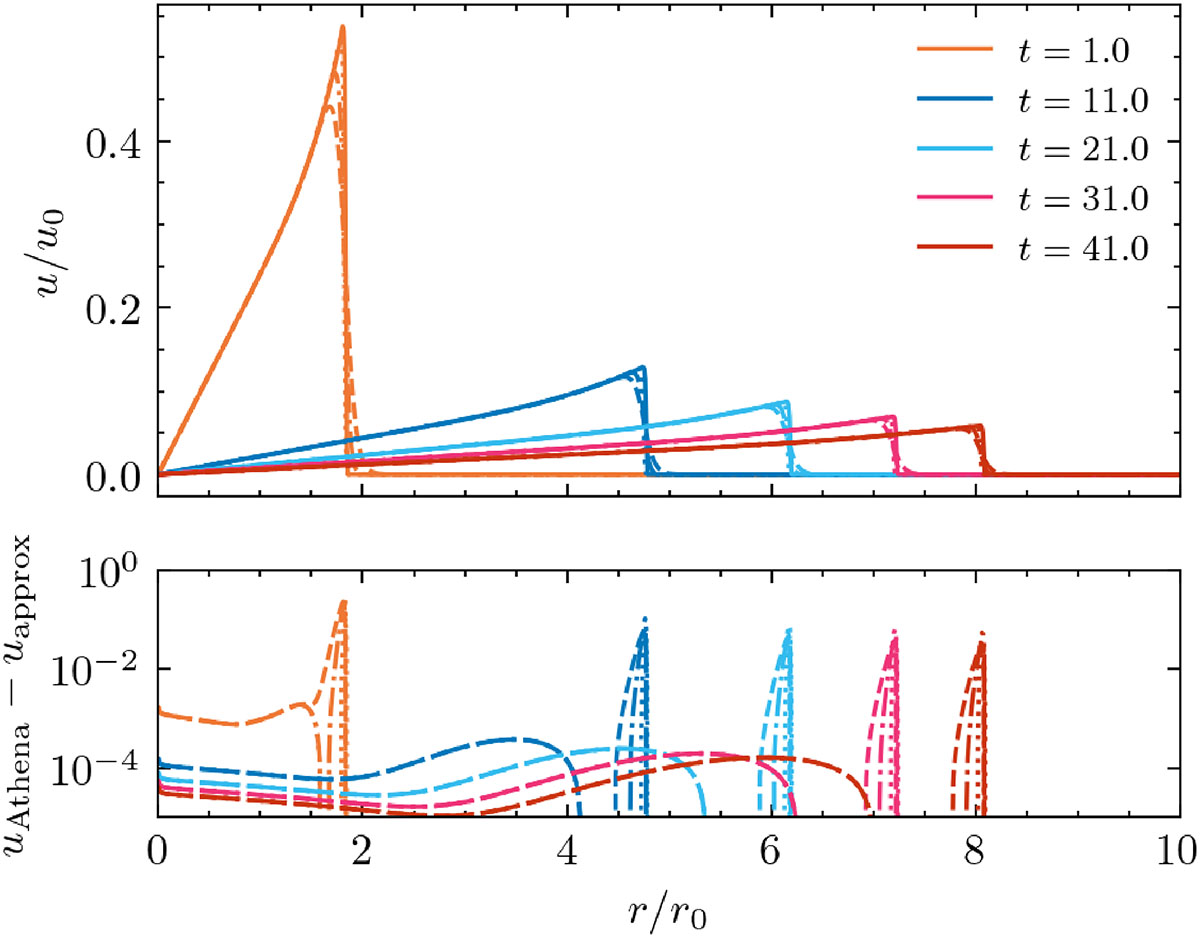
Top: Flow profile of the self-similar Sedov-Taylor solution. The shock slows down over time ∝t−3/5. Here, Einj = 20, ρ0 = 1. Athena++ simulation (solid line) is compared to analytical profile with different shock widths, lsh = [0.1, 0.05, 0.01] (dashed, dash-dotted, dotted line). Bottom: Absolute error between the Athena++ simulation and approximated analytical profile.
Current usage metrics show cumulative count of Article Views (full-text article views including HTML views, PDF and ePub downloads, according to the available data) and Abstracts Views on Vision4Press platform.
Data correspond to usage on the plateform after 2015. The current usage metrics is available 48-96 hours after online publication and is updated daily on week days.
Initial download of the metrics may take a while.