Open Access
Fig. 5
Download original image
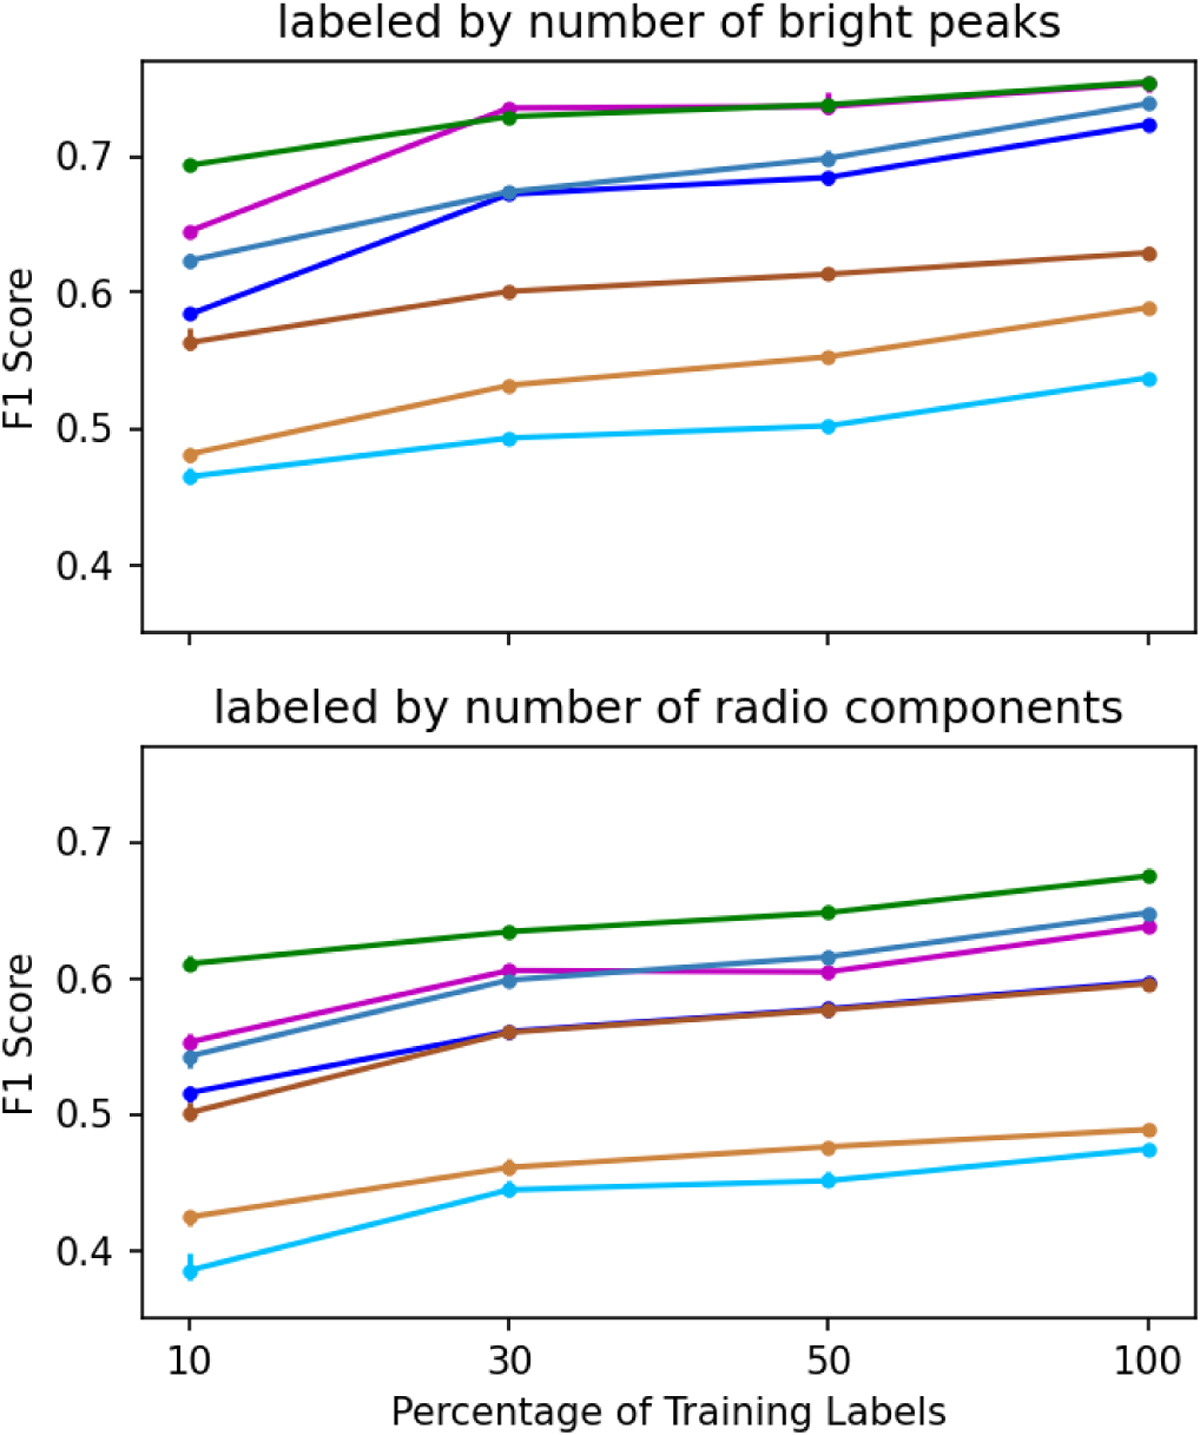
Label scheme redefined to the number of bright peaks (top) or number of individual radio components (bottom). Higher F1 scores in the top chart show that vision models are better at distinguishing bright peaks in images rather than flux islands defining radio components.
Current usage metrics show cumulative count of Article Views (full-text article views including HTML views, PDF and ePub downloads, according to the available data) and Abstracts Views on Vision4Press platform.
Data correspond to usage on the plateform after 2015. The current usage metrics is available 48-96 hours after online publication and is updated daily on week days.
Initial download of the metrics may take a while.