Fig. 6
Download original image
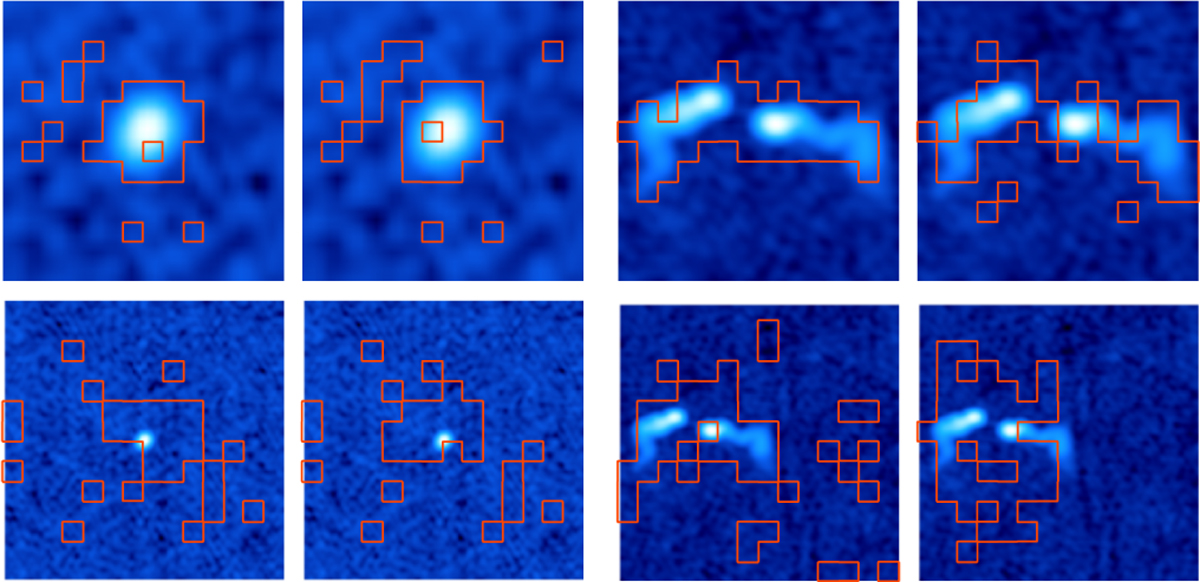
Attention maps (red contours) overlaid on closely cropped (top) and uncropped (bottom) RGZ images. A typical compact source (labeled as 1C-1P) is shown on the left, with a more complex source with diffuse elements (labeled as 2C-3P) on the right. The attention maps are shown for two different attention heads as contours at the 90th percentile level.
Current usage metrics show cumulative count of Article Views (full-text article views including HTML views, PDF and ePub downloads, according to the available data) and Abstracts Views on Vision4Press platform.
Data correspond to usage on the plateform after 2015. The current usage metrics is available 48-96 hours after online publication and is updated daily on week days.
Initial download of the metrics may take a while.