Fig. 1.
Download original image
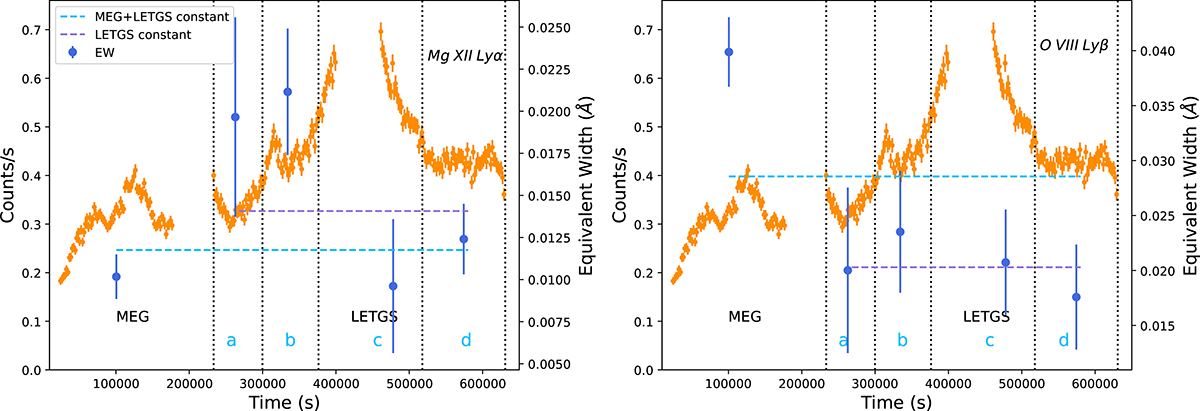
EW variation over time. The light curve during the MEG and LETGS observations from Kaastra et al. (2004) is plotted in the background as orange points. The vertical grey dotted lines and blue lowercase letters mark the split LETGS spectra discussed in the text. The blue points are the EW values. The dashed lines represent the average values from Table 3: light blue lines for the MEG and LETGS observations, and purple lines for the LETGS observation only.
Current usage metrics show cumulative count of Article Views (full-text article views including HTML views, PDF and ePub downloads, according to the available data) and Abstracts Views on Vision4Press platform.
Data correspond to usage on the plateform after 2015. The current usage metrics is available 48-96 hours after online publication and is updated daily on week days.
Initial download of the metrics may take a while.