Open Access
Fig. 1.
Download original image
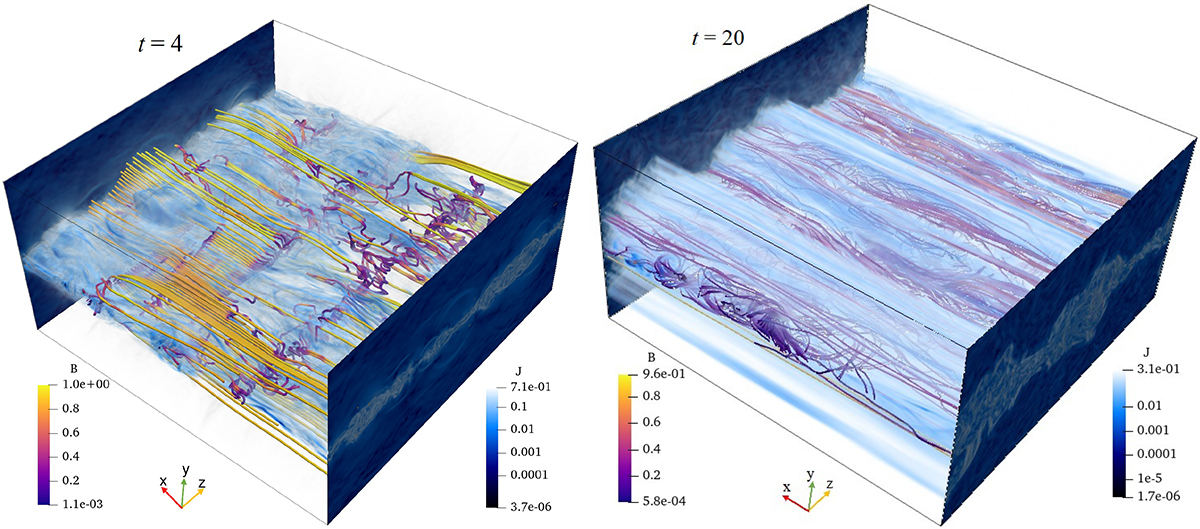
3D view of the turbulent reconnection structure at t = 4tA and 20tA. The solid lines represent the magnetic field lines colored with the field strength, filled in the 3D current isosurface with |J|≥0.01. This 3D view is based on SD2 listed in Table 1.
Current usage metrics show cumulative count of Article Views (full-text article views including HTML views, PDF and ePub downloads, according to the available data) and Abstracts Views on Vision4Press platform.
Data correspond to usage on the plateform after 2015. The current usage metrics is available 48-96 hours after online publication and is updated daily on week days.
Initial download of the metrics may take a while.