Fig. 3.
Download original image
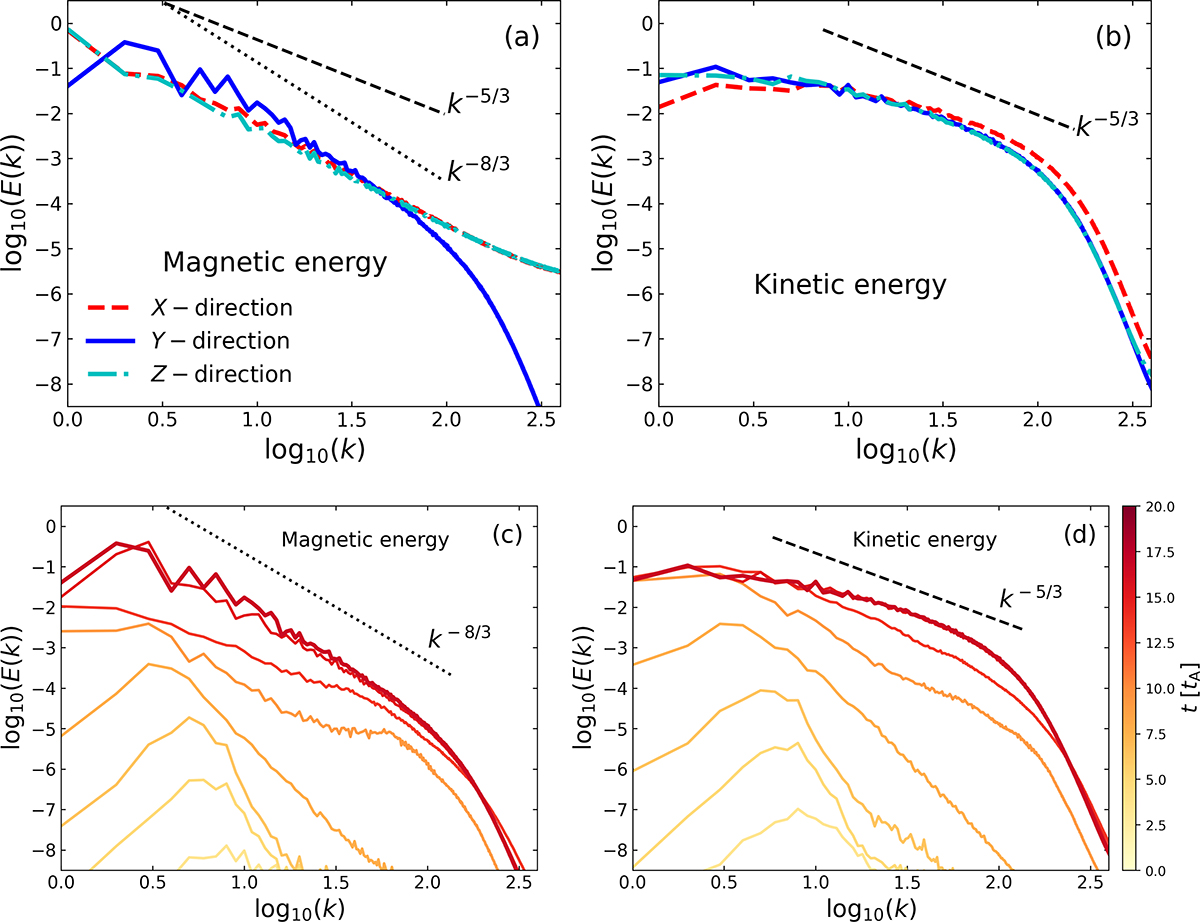
Spectral distributions of magnetic (left column) and velocity (right column) fields. Upper row: Spectral distributions in the three axis directions at t = 20tA. Lower row: Spectral evolutions in the process of turbulence development, where the color bar shows the simulation time in units of Alfvén time tA. These results are based on high-resolution simulations of SD1.
Current usage metrics show cumulative count of Article Views (full-text article views including HTML views, PDF and ePub downloads, according to the available data) and Abstracts Views on Vision4Press platform.
Data correspond to usage on the plateform after 2015. The current usage metrics is available 48-96 hours after online publication and is updated daily on week days.
Initial download of the metrics may take a while.