Fig. 4
Download original image
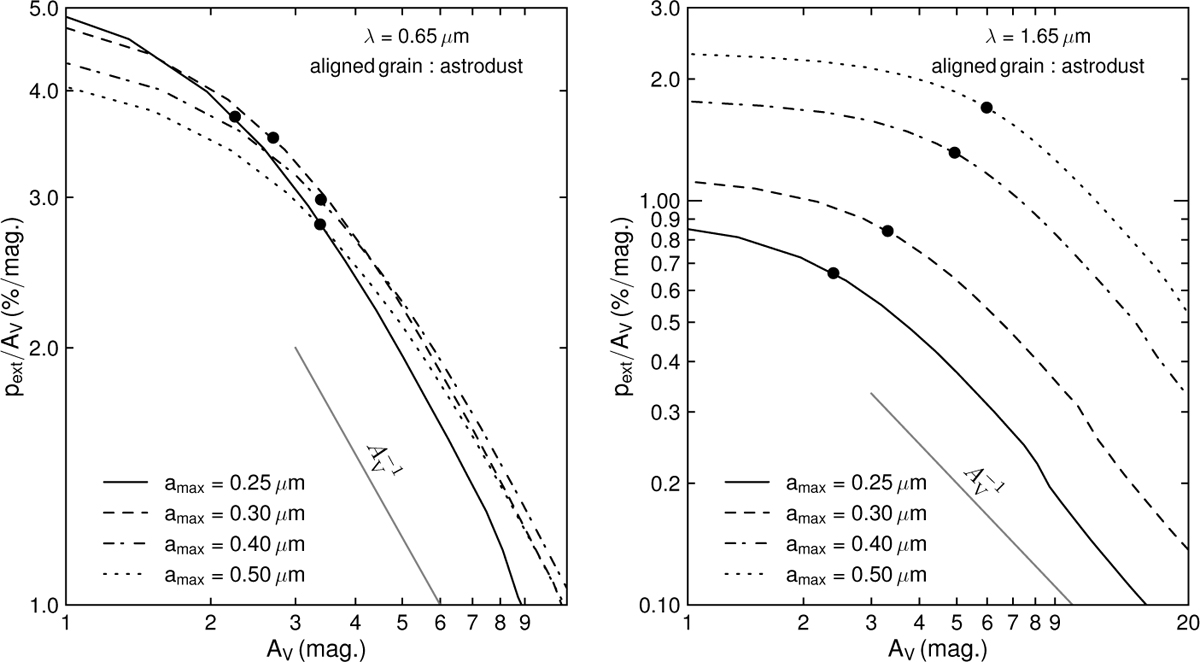
Relation between p/AV and AV for starlight polarisation at optical wavelength (R band, left panel) and near-IR (H band, right panel) wavelengths. Different lines represent different maximum grain sizes. The dots mark locations where the slope changes from <−1 to ≃−1. A slope of −1 indicates the complete loss of grain alignment.
Current usage metrics show cumulative count of Article Views (full-text article views including HTML views, PDF and ePub downloads, according to the available data) and Abstracts Views on Vision4Press platform.
Data correspond to usage on the plateform after 2015. The current usage metrics is available 48-96 hours after online publication and is updated daily on week days.
Initial download of the metrics may take a while.