| Issue |
A&A
Volume 703, November 2025
|
|
|---|---|---|
| Article Number | A192 | |
| Number of page(s) | 15 | |
| Section | Interstellar and circumstellar matter | |
| DOI | https://doi.org/10.1051/0004-6361/202553917 | |
| Published online | 17 November 2025 | |
Grain alignment and dust evolution physics with polarisation (GRADE-POL)
I. Dust polarisation modelling for isolated starless cores
1
Leiden Observatory, Leiden University, PO Box 9513, 2300 RA Leiden, The Netherlands
2
Max-Planck-Institut für Radioastronomie, Auf dem Hügel 69, 53121 Bonn, Germany
3
Korea Astronomy and Space Science Institute, Daejeon 34055, Republic of Korea
4
Department of Astronomy and Space Science, University of Science and Technology, 217 Gajeong-ro, Yuseong-gu, Daejeon 34113, Republic of Korea
5
Department of Astronomy, University of Wisconsin-Madison, Madison, WI 53706, USA
6
I. Physikalisches Institut, Universität zu Köln, Zülpicher Str. 77, 50937 Köln, Germany
7
McDonald Observatory, University of Texas at Austin, 2515 Speedway Boulevard, Austin, TX 78712, USA
8
Haystack Observatory, Massachusetts Institute of Technology, 99 Millstone Road, Westford, MA 01886, USA
9
Department of Astrophysics, Vietnam National Space Center, Vietnam Academy of Science and Technology, 18 Hoang Quoc Viet, Hanoi, Vietnam
10
Graduate University of Science and Technology, Vietnam Academy of Science and Technology, 18 Hoang Quoc Viet, Hanoi, Vietnam
11
National Chung Hsing University, 145 Xingda Rd., South Dist., Taichung City 402, Taiwan
★ Corresponding author: This email address is being protected from spambots. You need JavaScript enabled to view it.
; This email address is being protected from spambots. You need JavaScript enabled to view it.
Received:
27
January
2025
Accepted:
24
August
2025
Abstract
The polarisation of light induced by aligned interstellar dust serves as a significant tool in investigating cosmic magnetic fields and dust properties, while posing a challenge in characterising the polarisation of the cosmic microwave background and other sources. To establish dust polarisation as a reliable tool, the physics of the grain alignment process must be studied thoroughly. The magnetically enhanced radiative torque (MRAT) alignment is the only mechanism that can induce highly efficient alignment of grains with magnetic fields required by polarisation observations of the diffuse interstellar medium. Here, we aim to test the MRAT mechanism in starless cores using the multi-wavelength polarisation from optical to submillimetre. Our numerical modelling of dust polarisation using the MRAT theory demonstrates that the alignment efficiency of starlight polarisation (pext/AV) and the degree of thermal dust polarisation (pem) first decrease slowly with increasing visual extinction (AV) and then fall steeply as ∝Av-1 at large AV due to the loss of grain alignment, which explains the phenomenon known as polarisation holes. Visual extinction at the transition from shallow to steep slope (AVloss) increases with maximum grain size. By applying physical profiles suitable for a starless core, 109 in the Pipe nebula (Pipe-109), our model successfully reproduces the existing observations of starlight polarisation in the R band (0.65 μm) and the H band (1.65 μm), as well as emission polarisation in the submillimetre (870 μm). Successful modelling of observational data requires perfect alignment of large grains, which serves as evidence for the MRAT mechanism, and an increased maximum grain size with higher elongation at higher AV. The latter reveals the first evidence for a new model of anisotropic grain growth induced by magnetic grain alignment. This paper introduces the framework for probing the fundamental physics of grain alignment and dust evolution using multi-wavelength dust polarisation (GRADE-POL), and it is the first of our GRADE-POL series.
Key words: polarization / radiative transfer / ISM: clouds / dust, extinction / infrared: ISM / submillimeter: ISM
© The Authors 2025
 Open Access article, published by EDP Sciences, under the terms of the Creative Commons Attribution License (https://creativecommons.org/licenses/by/4.0), which permits unrestricted use, distribution, and reproduction in any medium, provided the original work is properly cited.
This article is published in open access under the Subscribe to Open model. This email address is being protected from spambots. You need JavaScript enabled to view it. to support open access publication.
1 Introduction
The polarisation of starlight and dust emission caused by alignment of dust grains (hereafter dust polarisation) is commonly used to detect magnetic fields in the interstellar medium (ISM) of our Galaxy (e.g. Pattle et al. 2023) and external galaxies, both nearby (e.g. Borlaff et al. 2023) and far away (e.g. Geach et al. 2023). It also presents a challenge as foreground contamination in the characterisation of the cosmic microwave background (e.g. Planck Collaboration 2020), exoplanetary atmospheres (e.g. van Holstein et al. 2021), and other sources. Hence, a thorough understanding of the physical processes behind dust polarisation and grain alignment is necessary.
After detections of the extinction (starlight) polarisation (Hall 1949; Hiltner 1949) and emission (thermal dust) polarisation (Cudlip et al. 1982), numerous studies have been carried out to establish a theory for the physics of grain alignment. The alignment by radiative torques (RATs), initially proposed by Dolginov & Mitrofanov (1976), has been widely accepted as a leading theory of grain alignment. This RAT idea was supported by numerical simulations in Draine & Weingartner (1996). Subsequently, the rotation of dust grains exposed to a laser beam was observed in a laboratory experiment (Abbas et al. 2004). A simple analytical model for helical grains presented in Lazarian & Hoang (2007) and numerical calculations in Hoang & Lazarian (2008) enabled efficient exploration of the parameter space for the dynamics of dust grains subjected to radiation. These analytical and numerical studies showed that the fraction of grains that can be aligned at an attractor point with high angular momentum J (called high- J attractors) by RATs strongly varies with the angle between the radiation and interstellar magnetic field directions. This angle dependence was also reported from observations in Andersson et al. (2011). Comprehensive studies on RAT alignment for a large sample of grain shapes are presented in Herranen et al. (2019, 2021). For the ensemble of shapes considered in Herranen et al. 2021, on average, only about 20-40% of the grains can be aligned at high- J attractors by RATs for a typical interstellar radiation field (ISRF; see their Figure 5).
For grains with embedded iron inclusions, the effect of magnetic relaxation cannot be ignored in the consideration of RAT alignment. The theoretical study in Lazarian & Hoang (2008) shows that the enhancement in magnetic susceptibility due to iron inclusions could increase the fraction of grains aligned at high-J attractors. For example, for a small magnetic inclusion, about 70% of the grains can align at high-J attractors, and a considerable iron inclusion can enable 100% of grains to align at high-J attractor for the same ISRF (see Hoang & Lazarian 2016 and Figure 10 in Herranen et al. 2021). In particular, numerical calculations in Hoang & Lazarian (2016) show that grains can be perfectly aligned by a magnetically enhanced RAT (also known as MRAT) mechanism. The classical RAT theory has been shown to qualitatively reproduce dust polarisation observations from diffuse to molecular clouds (MCs; see review in Andersson et al. 2015). However, a quantitative comparison between theoretical modelling and Planck observational data reveals the need for highly efficient grain alignment in the diffuse ISM (Hensley & Draine 2023) and in MCs (Reissl et al. 2020), which requires the MRAT mechanism. In particular, the high polarisation of up to 30-40% observed in dense protostellar environments by the Atacama Large Millimeter Array (ALMA) provides strong support for the MRAT mechanism (Giang et al. 2023; Giang & Hoang 2024; Thang et al. 2024; Giang et al. 2025). In this paper, we seek evidence of MRAT in dense starless cores, which are intermediate structures between MCs and protostellar cores.
The continuous development of the RAT alignment theory (Hoang et al. 2019; Hoang & Tram 2020) demonstrates that in the presence of a strong radiation field, large dust grains rotating at high-J attractors can achieve an exceptionally high angular velocity. These grains spontaneously disrupt into smaller fragments once the centrifugal force within the grains exceeds the binding force that holds them together. This effect of rotational disruption is termed radiative torque disruption (RAT-D). Laboratory experiments show extremely rapid rotation of objects due to laser irradiation (e.g. Reimann et al. 2018; Ahn et al. 2018), and the disruptive impact of rotation is also observed in simulations (Reissl et al. 2024) and laboratory experiments (Holgate et al. 2019). The combination of RAT alignment with RAT-D mechanisms constitutes the RAT paradigm, which accounts for a wider range of dust polarisation towards star-forming regions (see the review in Tram & Hoang 2022). Thus, the RAT paradigm is a foundational framework to describe grain alignment and grain disruption driven by radiation.
To extend the application of the RAT paradigm in various astrophysical environments, we developed a physical (forward) model to predict the degree of polarisation at multiple wavelengths for both starlight polarisation, pext and thermal dust polarisation, pem. This physical model is based on the alignment degree predicted by the RAT paradigm, but it assumes a uniform magnetic field, neglects the depolarisation owing to fluctuations of this field, and excludes the radiative transfer process. The model is coded in PYTHON and described in Lee et al. (2020) and Tram et al. (2021a). We name this code DUSTPOL_PY1. Despite its simplicity, DUSTPOL_PY reproduces the relation of pem with dust temperature (a proxy for radiation intensity) in star-forming regions, both when averaging over the cloud (Lee et al. 2020; Tram et al. 2021a,b) and on a map (pixel-by-pixel; Ngoc et al. 2024). This model also reproduces the spectrum of thermal dust polarisation, from 54 to 850 μm in the Orion Molecular Cloud 1 (OMC-1) (Tram et al. 2024). In these early investigations, the model is treated as zero-dimensional and includes local physical parameters such as the gas volume density and the dust temperature, which are derived from observations. Furthermore, the model’s ability to predict starlight polarisation is not thoroughly utilised.
Another longstanding problem in dust astrophysics is how dust grains grow in the ISM and in dense MCs. It is well known that grains can grow by gas accretion and grain-grain collisions, but the detailed physics is unclear. Traditionally, grain growth is assumed to be isotropic because of the random motion of gas and grains, which results only in an increase in grain size (see, e.g. Hirashita & Li 2013); however, the evolution of grain shape during grain growth has not yet been studied in detail. Therefore, some authors suggest that grain growth makes large grains more spherical and thus reduces dust polarisation efficiency, which might explain the polarisation hole (Weintraub et al. 2000; Gupta et al. 2025). However, this suggestion conflicts with the high degree of polarisation of starlight and dust emission in dense protostellar cores observed by ALMA, where grain growth is most efficient. A recent theoretical study in Hoang (2022) reveals two new effects of grain alignment on grain growth. First, the growth of aligned grains through gas accretion becomes anisotropic due to the alignment of grains with the magnetic field. This results in an increase in grain elongation during the grain growth process. Second, grain growth by coagulation via collisions between aligned grains results in the formation of composite grains with elongation increasing with grain growth. Polarisation is a unique tool to constrain both grain size and shape, as shown in the pioneering study for the ISM by Draine (2024). Nevertheless, the shape of dust grains and their effect on dust polarisation in dense clouds, where grain growth is most efficient, are not well studied. Compared to the prolate shape, oblate grains show a better fit to the observed mid-infrared polarisation towards Orion Becklin— Neugebauer (Aitken et al. 1989) and the Chamaeleon I cloud (Andersson & Potter 2010; Andersson et al. 2011). However, Draine & Hensley (2021) showed that both prolate and oblate grains can reproduce mid-infrared polarisation towards two lines of sight in the diffuse ISM presented in Wright et al. (2002). Recently, Reissl et al. (2024) have shown that the fast rotation of grains and the resulting centrifugal force can cause them to have oblate shapes, with elongation increasing with the rotation rate. Since RATs cause grain alignment and suprathermal rotation, they are also important for the evolution of grains in size (growth and disruption) and shapes (oblate and elongation).
In this work, our objective is to constrain the physics of grain alignment and dust evolution using dust polarisation (GRADEPOL). Towards this goal, we improve our DUSTPOL-PY code and apply it to isolated, starless, spherical cores. Starless cores are ideal targets for our study because of the high densities at which grain growth is expected to occur, and grain alignment remains significant. Numerous starless cores have been observed at multiple wavelengths, from starlight polarisation in optical and near-infrared (near-IR) to thermal dust polarisation in the submillimetre (submm) range. These observations usually report a drop in pext/AV and/or pem from the cloud surface to the core centre as a function of the total intensity (I) or visual extinction (AV), following a power law (pext/AV ~ Av-α or pem ~ AV-α) (see, e.g. Gerakines et al. 1995; Whittet et al. 2008; Alves et al. 2014; Hull et al. 2014). In some cases, this slope, α, approaches 1 in close proximity to the core centres (Jones et al. 2015), which is known as the polarisation hole.
Earlier studies have attempted to interpret observed dust polarisation in starless cores, using the original classical RAT theory from Lazarian & Hoang (2007), for starlight polarisation (Whittet et al. 2008; Hoang et al. 2015) and thermal dust polarisation (Cho & Lazarian 2005; Bethell et al. 2007). Most recently, based on the RAT paradigm, the theoretical work in Hoang et al. (2021), with a simple radiative transfer consideration, explains that the slope of pem ~ AV-1 could result from the loss of aligned grains and predicts that the pem - AV relation could be used to investigate grain growth in starless cores. In this paper, we simultaneously model the multi-wavelength polarisation of starlight and thermal dust emission using the state-of-the-art RAT paradigm and compare it with observational data.
In our previous research, we have explored three scenarios for dust grain population: separate silicate and carbonaceous particles, and mixed compositions. Specifically, using multiple wavelengths of thermal dust polarisation in Tram et al. (2024), we demonstrate that a combined composition of carbonaceous and silicate (bonded together) is necessary to understand observations towards the OMC-1. This mixture leads to a flat polarisation spectrum in the submm range because of the slightly different temperatures of the silicate and carbonaceous grains. This characteristic is similar to the new model of composite cosmic dust (ASTRODUST) introduced by Hensley & Draine (2023), which effectively reproduces the flat spectrum observed by Planck and the BlastPOL balloon. Composite interstellar dust was first proposed in Mathis & Whiffen (1989); Tielens (1989). In addition, numerical simulations in Reissl et al. (2024) show that a rotating grain is likely to have an oblate shape. In this work, we incorporate and consider only the oblate ASTRODUST composition.
This paper is structured as follows. We summarise the fundamental mathematical formalism for the physical properties of starless cores and alignment by RATs used in DUSTPOL-PY in Section 2. Section 3 presents the numerical results. We discuss our findings in Section 4, in which we model the multi-wavelength polarisation and compare it to observations for the Pipe-109 starless core at optical, near-IR, and submm wavelengths. Conclusions are given in Section 5.
2 Model formalism
Here, we first review the foundational formulations and physical parameters that underlie our model, including the astrophysical object and dust alignment. For the dust model, we consider the optical constants of the new ASTRODUST (Hensley & Draine 2023).
2.1 Numerical setup
This work focuses on starless cores (or dense clouds), which are assumed to have a spherical geometry with radius rout (see Figure 1). The line of sight follows the ẑ direction in Cartesian coordinates.
Calculations were carried out on the x̂ẑ plane with y = 0 (the largest circular slice). We sampled 102 values of r0 from 0 to rout, and 200 values of s from -rout to rrout. The samplings were in linear space. For a given line of sight, ŝi, with a projected distance to the centre of the core of r0, the radial distance along this line of sight was  with |s| varying from -rout to rout. Due to the assumption of spherical symmetry of the starless core, the calculations were not executed for ri > rout.
For each line of sight at position r0, the visual extinction  observed by the observer was calculated as
 (1)
(1)
with the optical depth given by
 (2)
(2)
Here, Qext is the extinction efficiency of the dust grain and dn∕da is the grain size distribution with minimum size (amin) and maximum size (amax). For a given grain size distribution, visual extinction is sensitive to the chosen maximum grain size; for example, a smaller amax results in a higher AV. We did not model the evolution of grain size within the cores.
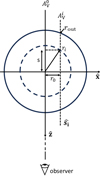 |
Fig. 1 Coordinate system of the starless core on the (x,z)-plane with the ẑ direction towards the observer. The position in the plane of the sky is defined by r0. Each line of sight, ŝ, corresponds to a distinct visual extinction, AV, calculated from the gas volume density profile along this direction. At a location ri on the sight line, the physical parameters (such as gas density, temperature, and radiation field) are assumed to be uniform on the dashed circle. |
2.2 Physical profiles
This section outlines the parametric expressions for the physical profiles applied in our model. We refer to Hoang et al. (2021) for the original and detailed derivations.
2.2.1 Gas density and attenuation
We considered a typical density model of starless cores with a flat central peak and a decreasing gas density outward. Let n0 be the gas density in the central region and r the radial distance from the centre. The density profile is described by
 (3)
(3)
where r extends to rout, with n0, rout, rflat, and α treated as parameters within our model. We considered only the particular case of α = 2, consistent with Whitworth & Ward-Thompson (2001). The other three parameters were adjusted based on observational constraints, e.g. gas volume density or visual extinction. The case of α = 0 corresponds to a uniform molecular cloud.
The gas column density (NH), integrated from the centre to the position r in the envelope along the radial distance, and the corresponding visual extinction ( ) were
 (4)
(4)
where RV denotes the total-to-selective extinction ratio. We adopted RV = 4 to account for the larger grains relative to the typical interstellar medium. The visual extinction ( ), measured from the envelope to the centre, were expressed as
 (5)
(5)
It should be noted that this visual extinction characterises the extinction from the surface to the position r along the radial direction and differs from the line of sight AV in Equation (1).
2.2.2 Radiation field and grain temperature
Due to the lack of embedded internal radiation sources within a starless core, the local radiation field inside the starless core was just an attenuated interstellar radiation field (ISRF). Let urad be the radiation energy density and U be the strength of the local radiation field, defined as U = urad/uMMP where uMMP = 8.64 × 10⁻¹³ erg cm−3 is the energy density of the local radiation field in the solar neighbourhood (Mathis et al. 1983). Following numerical calculations in Hoang et al. (2021), who fitted empirical functions to the results of radiative transfer calculations, the strength of the attenuated ISRF at a visual extinction  inside a starless core was parameterised as
 (6)
(6)
Here, uλ is the specific radiation energy density in units of erg cm−4, and U0 is the radiation strength measured at the cloud surface, which is assumed to be the same as that of the diffuse ISRF. For a typical ISRF in the solar neighbourhood (Mathis et al. 1983), U0 = 1, but a recent study suggests U0 = 1.5 (Bianchi 2024).
The corresponding mean wavelength of the ISRF was
![Mathematical equation: \bar{\lambda}(A^{\rm ext}_{\rm V}) = \frac{\int_{0}^{\infty} \lambda u_{\lambda}(A^{\rm ext}_{\rm V})d\lambda}{\int_{0}^{\infty} u_{\lambda}(A^{\rm ext}_{\rm V})d\lambda} = \bar{\lambda}_{0}\left[1+0.27\times \left(A^{\rm ext}_{\rm V}\right)^{0.76}\right],](/articles/aa/full_html/2025/11/aa53917-25/aa53917-25-eq13.png) (7)
(7)
where λ̄0 is the mean wavelength of the ISRF at the cloud surface, which is typically λ̄0 = 1.2 μm.
We assumed that gas and dust were in thermal equilibrium, i.e. Tgas = Tdust. Therefore, one can determine the gas and dust temperatures using the radiation strength given by Equation (6) and the formula from Draine (2011)
![Mathematical equation: T_{\rm d}(A^{\rm ext}_{\rm V}) = T_{\rm gas}(A^{\rm ext}_{\rm V}) = 16.4\,{\rm K}\times \left(\frac{a}{0.1\,\upmu m}\right)^{-1/15}\left[U\left(A^{\rm ext}_{\rm V}\right)\right]^{1/6}.](/articles/aa/full_html/2025/11/aa53917-25/aa53917-25-eq14.png) (8)
(8)
2.2.3 Grain size distribution
We used the well-known MRN-like grain size distribution with dn/da ~ Caβ (with β being a negative number). The normalisation factor, C, was estimated by mass conversion as (Tram et al. 2020, 2021a)2
 (9)
(9)
where Md/g is the dust-to-gas mass ratio (Md/g = 0.01 for a typical ISM), ρdust is the volume density of the dust mass (ρdust = 2.71 g cm−3 for ASTRODUST with 20% porosity (Hensley & Draine 2023), and mgas = 2.8n(H2)mH ≃ 1.4nHmH is the mean molecular gas mass per hydrogen atom3. Note that this normalisation factor establishes the value of the line-of-sight extinction AV, but cancels out when considering the starlight polarisation to extinction (pext/AV - mostly used in observations), as well as the thermal dust polarisation pem. In contrast, the power law of the distribution exerts a significant influence.
2.3 Grain alignment by the radiative torque paradigm
The physics of grain alignment by radiative torques has been described in detail in numerous works. In this section, we restate the principles of this theory and the formulations for our model. For more details, we refer to the most recent reviews in Andersson et al. (2015); Tram & Hoang (2022) and studies in Lazarian & Hoang (2021); Hoang et al. (2022). Moreover, with the adoption of the ISRF and the presence of dense gas in starless cores, RAT-D could not take place, leading us to disregard the formulation of this rotational disruption.
2.3.1 Radiative torques
The average radiative torque induced by the interaction of an irregular grain (with an effective size a) and an anisotropic radiation field (with isotropic degree γ) is
 (10)
(10)
where urad = UuMMP is the energy density of the local radiation field, and Q̄Λ is the RAT efficiency given by
 (11)
(11)
The RAT efficiency power index of -2.7 and the transition at λ̄/1.8 differ slightly from the slope of -3 and the transition at λ̄/2.7 in Hoang et al. (2021). However, this discrepancy in the torques is very small, as shown in their Figure 1.
2.3.2 Angular velocity and grain alignment size
Radiative torques (RATs) can spin up and irregular grain to a finite angular velocity (ωRAT). The maximum angular velocity that an irregular grain is gained by RAT is given by
 (12)
(12)
where Ia = 8πρa5/15 is the grain moment of inertia, with ρ being the grain mass density, and τdamp is the rotational damping time that characterises the damping caused by gas-grain collisions, followed by evaporation and infrared emission.
The rotational damping timescale is given by
 (13)
(13)
where FIR is the ratio of damping timescales between gas collisions and infrared emission, which is approximately given by
 (14)
(14)
When FIR ≪ 1 (for instance, when U2/3/nH ≪ 1), the damping timescale of the grain is influenced by the density and temperature of the gas. Conversely, if FIR ≫ 1 (for example, U2/3/nH ≫ 1), the damping timescale  becomes independent of the gas density and temperature. In starless cores, the former scenario applies.
The grain alignment remains effective if its angular velocity is three times greater than the thermal angular velocity ((kBTgas/IA)1/2) (see Hoang & Lazarian 2008). Therefore, the minimum grain size that can be effectively aligned (referred to as the alignment size, aalign) is the solution of the following equation:
 (15)
(15)
2.3.3 Alignment function
The alignment of grains with the ambient magnetic field can be characterised by two processes: internal alignment (where the grain’s minor axis aligns with its angular momentum, J ; see e.g. Spitzer & McGlynn 1979) and external alignment (where the angular momentum aligns with a preferred axis, which could be the ambient magnetic field, radiation field, or gas flow; see Tram & Hoang 2022 for a review). The efficiency of internal alignment is described by QX, while external alignment is described by QJ. The net grain alignment efficiency is quantified by the Rayleigh reduction factor of R(a) = 〈QXQJ〉 where the brackets denote the average over an ensemble of grains of the given size a (see Hoang et al. 2015). Since grains aligned at high-J attractors have perfect internal alignment due to suprathermal rotation, i.e. QX = 1. Therefore, we can approximate R ≃ fhigh-J.
The MRAT theory predicts the dependence of fhigh on the local gas density and the magnetic properties of the grain, with fhigh-J = 1 for superparamagnetic grains (Lazarian & Hoang 2008; Hoang & Lazarian 2016). Numerical calculations of grain alignment using MRAT theory Hoang & Lazarian (2016) show that the degree of alignment tends to increase smoothly with grain size, consistent with results from inverse modelling of starlight polarisation (Hoang et al. 2014). Therefore, the alignment function can be parameterised as
![Mathematical equation: f(a) = f_{\rm max}\left[1-e^{-(0.5a/a_{\rm align})^{3}} \right],](/articles/aa/full_html/2025/11/aa53917-25/aa53917-25-eq23.png) (16)
(16)
which implies f (a ) = fmax for a ≫ aalign and f(a) → 0 for a ≪ aalign. The case of fmax = 1 is referred to as a perfect alignment of large grains by RATsaa.
2.4 Degree of dust polarisation
2.4.1 Starlight polarisation
The degree of starlight polarisation for a population of dust, along a given line of sight in the optically thin case is (see, e.g. Hoang et al. 2015)
 (17)
(17)
where ψ is the inclination angle between the magnetic field orientation and the line-of-sight, Fturb is the turbulence factor characterising the fluctuation of the magnetic field, and  is the extinction polarisation coefficient. This efficiency is determined by the residual of the extinction efficiencies in the two components where the electric field is parallel and perpendicular to the grain rotation axis (a), expressed as 0.5 [Qext(E||a) - Qext(E ⊥ a)]. These components are taken from the ASTRODUST database4. Here, Fturb = 0.5[3〈cos2(∆θ)〉 -1], where ∆θ denotes the angular deviation between the local magnetic field and the average field (see Truong & Hoang 2025). Since local and average fields are difficult to disentangle, Fturb is generally difficult to define. However, when the cloud is sub-Alfvénic, this factor can be estimated via the angle dispersion of the magnetic fields, δθ, as Fturb ≃ 1 - 1.5(δθ)2. The expression Fturb × sin2 ψ in Equation (17) determines the influence of magnetic field changes, both in 3D orientations and fluctuations. For clarity, we assume Fturb = 1 and ψ = 90° in subsequent sections, while discussing their effects specially in the Pipe-109 case study in Section 4.4.
2.4.2 Thermal dust polarisation
In the presented version of our model, the degree of thermal dust polarisation was calculated for the optically thin case. With a uniform magnetic field orientation, the total and polarised intensity can be estimated analytically, as described by Cho & Lazarian (2005); Lee et al. (2020); Tram et al. (2021a); Hoang & Truong (2024); Tram et al. (2024). The total emission intensity at a given position along a line of sight (denoted by ri in Figure 1) is calculated as
 (18)
(18)
Naturally, this intensity depends on the line-of-sight AV, as determined in Equation (1). The black-body radiation at dust temperature Td is given by Bλ(Td), while Qabs is the extinction coefficient and a function of a and λ. In this study, we disregarded the distribution Td, which contrasts with the previous configuration in DUSTPOL_PY. This assumption is particularly justifiable for starless cores, where grains are probably large, making the nanodust contribution insignificant. The distribution of Td for large grains is a delta function (see Figure 8 in Lee et al. 2020).
The local polarised intensity of thermal dust at the same location ri as above is given by
 (19)
(19)
where  is the absorption polarisation efficiency, determined by 0.5 [Qabs(E || a) - Qabs(E ⊥ a)]. These components were also taken from the ASTRODUST database. The angle ψ scales the amplitude of the degree of polarisation, but does not influence the shape of the spectrum, with the degree maximised for ψ = 90° (i.e. when the magnetic field lies completely in the plane of the sky). As aforementioned, in the following, we therefore consider the case of ψ = 90° and discuss its effect later in Section 4.4. The degree of thermal dust polarisation along a given line of sight is computed as
 (20)
(20)
3 Numerical results
3.1 Physical properties
We aim to compare the polarisation degree from observations of starless cores, such as Pipe-109, with a maximum AV at a centre of 50 mag. Accordingly, we adopt n(0) = 5 × 105 cm−3 at the centre, rflat = 0.024 pc, and rout = 0.6 pc for our starless core setup (see Section 4.1); the density decreases towards the envelope as r−2. The interstellar radiation field is taken as U0 = 1 with γ = 0.3 (for a dense core; see Bethell et al. 2007). For grain alignment, we consider the perfect alignment of large grains of size a ≫ aalign with the magnetic field by the MRAT mechanism (Hoang & Lazarian 2016) and set fmax = 1. The summary of the parameters is given in Table 1.
We make the following key assumptions. Along an individual line of sight, while the physical profiles (gas density, temperature, radiation field, etc.) vary locally, we keep amax constant along this line of sight, although amax would not be the same for different locations along it.
The left panel of Figure 2 displays the map of visual extinction (AV) in the V band (0.55 μm) along each line of sight in the plane of the sky (x̂ŷ). Moving towards the centre, the density of the gas increases and the length ŝ becomes longer, leading to a higher AV. The right panel of Figure 2 shows the corresponding alignment size map (aalign) in the x̂ẑ plane. From the periphery to the centre, the gas density increases, while the radiation field notably decreases, and its mean wavelength becomes longer, resulting in a larger alignment size. Hence, to remain aligned deeper into the cloud, the average grain size must be larger.
Input parameters.
3.2 Starlight polarisation
Figure 3 shows the spectrum of starlight polarisation, pext/AV, (the polarisation efficiency), as defined in Equation (17) for different values of AV. The degree of polarisation decreases with depth into the core (higher AV). The polarisation is strongest in the optical to mid-IR, and then drastically drops at longer wavelengths. The left and right panels correspond to two different values of amax. Compared to the smaller amax, the larger grain size results in a lower maximum value of pext/AV at low AV but a higher value at higher AV, and the degree of polarisation in the silicate absorption features at λ = 10, 18 μm, is greater. Moreover, the spectrum is broader for larger amax. These effects arise from the contribution of larger aligned grains.
Figure 4 illustrates the relationship between pext/AV and the line-of-sight AV at two specific wavelengths: an optical wavelength (R band at 0.65 μm, left panel) and a near-IR wavelength (H band at 1.65 μm, right panel). Generally, the polarisation efficiency decreases rapidly as AV increases. Above a certain  , pext/AV ~ AV-1, which implies the complete loss of grain alignment when
  . The values of
  marking the transition between shallow and steep slopes are marked by black dots5.
This occurs because, towards higher AV, aalign increases, and the polarisation disappears where aalign > amax. For a larger grain size that still maintains its alignment much deeper inside the cloud (higher AV),  is higher than for smaller sizes. Consequently, the polarisation in the optical band at the surface is higher for smaller grain sizes, as expected. Deeper inside the cloud, the alignment of smaller grains is rapidly reduced, whereas that of large grains remains.
A similar trend is observed for the H band (right panel), but the alignment efficiency is lower for smaller amax when the grain size is sufficiently small compared to the wavelength (that is, for a ≤ λ̄/1.8, the radiative torque decreases rapidly for smaller grains; see Equation (11)). The left panel of Figure 5 shows the dependence of  on amax for several wavelengths in the optical and near-IR ranges, commonly used in observations. The value of
  shows no significant change for smaller values of amax but is affected when amax is relatively larger. Longer-wavelength observations can detect dust polarisation at greater depths within the cloud.
Figure 3 also shows that the wavelength λmax, where the polarisation spectrum reaches its maximum in the UV-NIR range, is longer for higher AV. The right panel of Figure 5 illustrates the relationship between λmax and AV. As AV increases, λmax initially increases and then becomes constant. The initial increase is due to an increase in the gas density. The values of AV above which λmax is saturated are higher for larger amax. Furthermore, λmax is longer for larger amax. These features arise because larger grains can align more deeply within the cloud. The trend is consistent with previous studies in Whittet et al. (2008); Hoang et al. (2015); Vaillancourt et al. (2020).
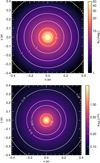 |
Fig. 2 Top panel: full map on the plane of the sky (x̂ŷ plane) of the line-of-sight visual extinction. Bottom panel: alignment size along the line of sight (x̂ẑ plane). We adopt n0 = 5 × 105 cm-3, rflat = 0.024 pc, α = 2, U0 = 1, γ = 0.3, oblate grains (axial ratio of 1.4) with amax = 1 μm, β = -3.5, and fmax = 1. This setup mimics the scale of the Pipe-109 starless core, whose data will be used later in this work. |
3.3 Polarisation spectrum of thermal dust polarisation
Figure 6 demonstrates the polarisation spectrum for the thermal dust emission from Equation (20) along different lines of sight. It initially exhibits an upward trend in the spectral profile, which then becomes constant at longer wavelengths. The spectra maintain their trend but vary in absolute values for different line-of-sight AV. The notable distinction is that larger grain sizes yield a greater degree of polarisation, pem, compared to smaller sizes under the same physical conditions.
Figure 7 shows the dependence of pem on AV at 870 μm. This linkage, defined by the pem - AV relation, reflects an alignment efficiency similar to that of pext/AV - AV for starlight, primarily because the nH terms in the numerator and denominator of Equation (20) cancel out, although nH indirectly influences the alignment size. Typically, as the centre is approached, the degree of polarisation decreases approximately following the relation pem ~ Av-η. Similar to the starlight polarisation, this slope is shallower than -1 in the envelope and becomes steeper near the centre. The physical reason for this transition is the loss of alignment. Consequently, for larger grains (amax > aalign), the slope is much shallower than -1. This critical AV transition depends mainly on the maximum grain size (amax) and is independent of the grain composition and the maximum alignment factor fmax. Interestingly, the slope can be slightly less than -1 in cases of no alignment due to integration over varying gas densities along the line of sight.
4 Discussion
4.1 Application to the Pipe-109 starless core
We compare our modelling results with observational data from the specific starless core Pipe-109 (also known as FeSt 1-457). First, we adjust the parameters rflat and rout to match this specific target. To do so, we compare the line-of-sight visual extinction predicted by our model to that observed, as shown in Figure 1 of Alves et al. (2014). The conditions are as follows: in the centre, AV = 50 mag, the diameter of AV = 20 is approximately 0.1 pc, while the area where AV = 10 extends to about 0.2 pc. The map of AV in the left panel of the sky plane in Figure 2 (for α = 2 and amax = 1 μm) closely matches that of the Pipe-109, corresponding to n0 = 5 × 105cm−3, rflat = 0.024 pc, and rout = 0.6 pc.
Comparisons of pext/AV and pem versus AV between the predictions of our model and the observations are shown in Figure 8, using data from Alves et al. (2014). In the model, a fixed grain elongation is assumed, an oblate grain with an axial ratio of 1.4 at optical and near-IR, while it is 2 at 870 μ because the predicted pem with an axial ratio of 1.4 is too low compared to the observed data, as illustrated in Figure A.1. This comparison includes three wavelengths: 0.65 μm (optical, first row), 1.65 μm (near-IR, second row), and 870 μm (submm, third row). In the model, only the maximum grain size, amax , is varied, as indicated by the different lines. To reproduce the data, amax must be larger for dust polarisation at longer wavelengths. Specially, using the parameter sets mentioned above, our model predicts that the maximum grain size ranges from 0.21 ≤ amax ≤ 0.34 μm at a wavelength of 0.65 μm, 0.28 ≤ amax ≤ 0.45 μm at 1.65 μm, and amax ≥ 1 μm at 870 μm for a more elongated grain with the axial ratio greater than 1.4. For visualisation, the combination of all wavelengths is shown in the fourth panel, with the shaded areas corresponding to the optimal ranges of amax. The explicit values of amax can change with different sets of parameters, but the requirement for larger amax at higher AV is unchanged.
Two separte slopes are evident at 1.65 μm, with one shallower for AV > 14 mag, which a single model cannot reproduce. However, distinct models with different values of amax can reproduce this trend, with the shallower slope corresponding to a larger amax. In general, grain size increases towards the centre. Our finding may be consistent with the speculation in Alves et al. (2014), in which the optical and near-IR wavelengths originate from the envelope of the starless core, while the submm observations originate from the core.
Figure 9 shows the comparison with fixed amax values of 0.21, 0.28 and 1.25 μm for the R, H, and submm bands (the lowest values in Figure 8), while varying the grain axial ratio. In this case, the agreement is poorer in the near-IR with AV > 14 mag and submm. Considering both the influence of the maximum grain size and elongation, reproducing these observations requires larger and more elongated grains deeper within the starless core.
Figure 10 compares pem - I at 870 μm with a fixed maximum grain size of 1 μm for different grain elongations. Furthermore, this figure provides a direct comparison with Figure 3 of Alves et al. (2014), in which the authors used the DUSTPOL model from Padovani et al. (2012) and manually applied a fixed polarisation efficiency, setting it to 0.18 for gas densities up to 6 × 104 cm−3 and zero beyond that range. The DUSTPOL model in Padovani et al. (2012) does not account for the physics of grain alignment; instead, it treats alignment as an adjustable parameter (α). Thus, our new physical modelling based on RAT physics provides a better approach to understanding dust polarisation in starless cores.
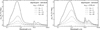 |
Fig. 3 Polarisation spectrum pext/AV vs. λ of starlight dust polarisation for different lines of sight (AV), shown for maximum grain sizes of 0.25 μm (left panel) and 0.5 μm (right panel). For λ ≤ 10 μm, the spectral feature is broader for larger maximum grain size. When AV is low, smaller amax yields a greater amplitude; however, this relationship inverts as AV increases. The oblate grains with an axial ratio of 1.4 are adopted. |
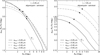 |
Fig. 4 Relation between p/AV and AV for starlight polarisation at optical wavelength (R band, left panel) and near-IR (H band, right panel) wavelengths. Different lines represent different maximum grain sizes. The dots mark locations where the slope changes from <−1 to ≃−1. A slope of −1 indicates the complete loss of grain alignment. |
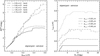 |
Fig. 5 Left panel: relation between |

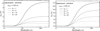 |
Fig. 6 Polarisation spectrum of thermal dust polarisation towards a starless core for different values of the line-of-sight visual extinction ( |

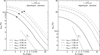 |
Fig. 7 Same as in Figure 4. Relation between pem and AV at 870 μm for different maximum grain sizes. The grey line shows a slope of −1, indicating a total loss of grain alignment. Smaller grains quickly lose their alignment within the cloud (left panel). If the grains are sufficiently large, the alignment is more efficient at the same AV, resulting in shallower slopes. |
4.2 Implications for grain alignment: magnetically enhanced radiative torque (MRAT)
The successful fitting of the multi-wavelength polarisation data observed toward the starless core Pipe-109 with the RAT alignment model with a maximum alignment degree of fmax = 1 and the composite ASTRODUST model suggests perfect alignment of large magnetic dust grains with a ≫ aalign. To achieve such a perfect alignment, the classical RAT theory alone is insufficient, which requires MRAT (Lazarian & Hoang 2008; Hoang & Lazarian 2016). This represents the first evidence of MRAT in starless cores. Previously, evidence for MRAT was supported by various studies of the diffuse IsM (Hensley & Draine 2023) and MCs (Reissl et al. 2020). Recent dedicated models with appropriate treatments of internal and external alignment processes in Giang et al. (2023); Giang & Hoang (2024); Thang et al. (2024); Giang et al. (2025) show that MRAT with iron inclusions is required to understand the dust polarisations in protostars, low-and intermediate-mass young stellar objects, and protoplanetary disk observed by ALMA.
We note that a lower value of fmax may be sufficient (without requiring MRAT, i.e. classical RAT theory is adequate) if the grain elongation is increased to an axial ratio greater than 3, or if the radiation intensity is sufficient to compensate for the strong randomisation of grain alignment by dense gas collisions. The first case may be possible because we show that grain growth (increase in amax) is accompanied by increased grain elongation; however, such extremely elongated grains would not survive destruction mechanisms such as shattering or disruption (see Draine 2024). The second case results in a higher degree of polarisation deeper within the cloud, making p versus AV relation shallower. However, there is no evidence of a nearby strong radiation source for the Pipe-109 core.
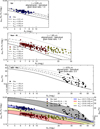 |
Fig. 8 Comparison of pext/AV and pem vs. AV from our model and the data of Pipe-109. In the optical (first row) and near-IR (second row) wavelengths, we plot pext/AV (alignment efficiency) against AV, while for the submm wavelength (third row), we use pem versus AV. The fourth row combines all datasets above, with a shaded region indicating the range of amax that covers the data shown in the above panels. The grain axial ratio at 870 μm is set to 2 because the value of 1.4 used at other wavelengths (as shown in Figure A.1) is too low. Polarisation data are adapted from Alves et al. (2014) and references therein. |
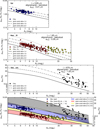 |
Fig. 9 Similar to Figure 8, but here polarisation is calculated for different grain elongations, while keeping maximum grain sizes constant, namely 0.21, 0.28, and 1.25 μm. For near-IR and submm data with AV > 14 mag, even at an axial ratio of 3, the model fails to cover all data points, indicating the need for larger grains, as shown in Figure 8. For optical and near-IR data with AV ≤ 14 mag, the models fit well. |
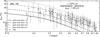 |
Fig. 10 Similar to Figures 8 and 9, but showing the pem - I relationships for thermal dust polarization at 870 μm. Our models nicely reproduce the observations. Data are taken from the public data file in Alves et al. (2014). |
4.3 Grains grow in starless cores
Grain growth is expected to occur in dense clouds due to gas accretion and grain-grain collisions (see, e.g. Hirashita & Li 2013), but the detailed physics of grain growth is not well understood. Traditionally, grain growth is assumed to be isotropic because of the random motion of gas and grains, which results only in an increase in grain size. However, a recent study by Hoang (2022) shows that grain growth becomes anisotropic due to grain alignment with ambient magnetic fields. As a result, grain growth can increase both in size and elongation, with larger grains having higher elongation.
In Section 4.1, we show that the combination of starlight and thermal dust polarisation in starless cores clearly demonstrates the need for larger grains, which implies significant grain growth in such dense environments. To examine the extent of grain growth in different environments, sufficient observations of starless cores with distinct physical characteristics are needed, because the reduction in the degree of polarisation with total intensity or visual extinction differs for varying amax. Our proposed diagnostic for grain growth using the relation pext/AV versus AV, as shown in Section 3, differs from and complements that previously described in Vaillancourt et al. (2020), in which the authors inferred grain growth using the relation of the maximum wavelength λmax with AV from multi-wavelength observations in optical to near-IR (see their Figure 5 or our Figure 5, right panel).
Specially, Figures 8 and 9 show that higher elongation at the larger AV can successfully reproduce the data. For instance, for maximum size of amax ≤ 0.28 μm, grain elongation between 1.4-2 matches the starlight polarisation data for AV < 14, but elongation of ~2-3 is required to fit the data at AV ~ 10-30. At AV > 30, high elongation of ~2-3 and large grains are required to reproduce the upper bound of the thermal dust polarisation data. This provides the first evidence for grain growth accompanied by an increase in grain elongation, as predicted by the anisotropic grain growth model of Hoang (2022). Another possible mechanism that produces more elongated grains is the centrifugal force arising from the fast rotation of grains induced by RATs (Reissl et al. 2024). However, in starless cores, the radiation field is weak and cannot elongate grains deeper inside the cores.
4.4 Effects of magnetic field geometry
Our numerical modelling assumed a uniform magnetic field in the plane of the sky. However, in realistic situations, the magnetic field varies along the line of sight.
First, magnetic turbulence can cause fluctuations of the local magnetic field with respect to the mean magnetic field. Due to this effect, the degree of polarisation is lower by a factor of Fturb < 1 (see Equations (17) and (19)). Using the polarisation angles outlined in Alves et al. (2014) for the Pipe-109 core, and assuming that this cloud is sub-Alvénic, we computed turbulence factors Fturb of 0.98, 0.96, and 0.91 for optical, Near-IR, and submm wavelengths, respectively. Evidently, the divergence from a uniform magnetic field scenario is minor at 2%, 4%, and 9%, indicating that the influence of Fturb is insignificant for this specific instance of Pipe-109.
Second, the mean magnetic field may not lie in the plane of the sky, but may instead form an angle  with respect to the line of sight. Numerical simulations for the formation of cores by Mocz et al. (2017) show that the inclination angle of the magnetic field varies from the outer to the inner region in cases of moderate and strong magnetic fields. Therefore, one cannot expect the magnetic field to be uniform, i.e. exhibit the same angle ψ in starless cores. In this case, the degree of polarisation will be reduced by a factor of fmal sin2 ψ (see Equations (17) and (19)). For Pipe-109, Kandori et al. (2018) studied magnetic fields using near-IR and submm polarisation and report that the magnetic field can be described by a parabolic form. Kandori et al. (2020) applied the flux-freezing model from Myers et al. (2018) to this core and find that the best-fit model yields the inclination angle of ψ = 35 ± 15°. Therefore, the model with a fixed grain elongation of 1.4 could not reproduce the observational data with amax mentioned above, because the maximum polarisation degree is reduced by a factor of sin2 35° ≈ 1/3 compared to the ideal model of ψ = 90°. This suggests that the elongation of the grains must be enhanced to reproduce the observed polarisation.
To illustrate the effect of grain elongation on polarisation, Figure 11 shows the polarisation spectrum of both starlight and thermal dust for oblate grains with axial ratios of 1.4 and 3. It is evident that more elongated grains result in higher polarisation. At the wavelengths discussed in this work (0.65, 1.65 and 870 μm), the degree of polarisation for the axial ratio of 3 is about 3.5 times that for the axial ratio of 1.4. Therefore, an accurate method to constrain the inclination angle of the magnetic field would help constrain grain elongation and grain growth physics (Hoang 2022).
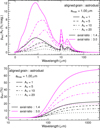 |
Fig. 11 Polarisation spectrum in absorption (top panel) and emission (bottom panel) for a maximum grain size amax = 0.5 μm with different axial ratios, of 1.4 and 3. The more elongated the grain, the higher the degree of polarisation. |
4.5 Uncertainties
The most obvious sources of uncertainty in this work are the assumption that the maximum grain size remains unchanged along the line of sight and that no treatment of grain evolution within the cloud is included. Proper models that consistently constrain the maximum grain size as a function of the physical condition could better reproduce the observations. However, as mentioned above, the quantitative value presented in this work might change, while the phenomena are expected to remain the same. The assumption that Tgas = Tdust may not hold for nH ≤ 106cm−3, as demonstrated in Figure 4 of Ivlev et al. 2019. The gas temperature can exceed that of the dust, potentially increasing the efficiency of rotational damping (see Equation (13)). Accurate modelling of heating and cooling processes could improve the accuracy of our model. In addition, the assumption of optical thickness for thermal dust polarisation holds at 870 μm, but might cause uncertainty at shorter wavelengths (e.g. mid-IR to far-IR).
5 Conclusions
Significant advances have been made in our understanding of dust grain alignment physics, alongside a substantial increase in high-quality multi-wavelength dust polarisation data. Grain growth in dense clouds is the first step in planetesimal formation. However, the detailed mechanisms of grain alignment, as well as the process of grain growth and its underlying physics, are not well understood. Starless cores, which exhibit minimal internal dynamics and have the potential to form young stars, serve as the simplest and most suitable targets to better understand these physical processes. In this study, we aim to constrain the physics of grain alignment by radiative torques and dust evolution using the multi-wavelength dust polarisation observed toward starless cores. The main findings of our study are summarised as follows:
We model multi-wavelength polarisation for both starlight and emission using a newly proposed composition of interstellar dust (ASTRODUST) and the MRAT alignment theory, with perfect alignment of large grains for a starless core in which grains are aligned by the attenuated interstellar radiation field. Different maximum grain sizes and elongations are considered, and the magnetic field is assumed to lie in the plane of the sky;
Our model indicates that the reduction in the degree of polarisation towards the centre (referred to as the polarisation hole) is primarily caused by the loss of dust grain alignment of small grains in dense gas (due to gas collisional damping) and by the decrease in radiation intensity (attenuation). Larger grains can still maintain alignment deeper into the core due to the effect of longer wavelength photons;
-
We tailor our model to a particular case of the Pipe-109 core as a showcase.
The results of our optimal polarisation model (i.e., B-fields in the plane of the sky) can nicely reproduce the observational data consistently for optical (R band), near-IR (H band), and submm (870 μm);
In particular, we find that grains must be larger and more elongated at higher visual extinction (deeper inside the cloud) to match observations. This is the first evidence for grain growth that involves both maximum size and grain elongation, consistent with the anisotropic grain growth model for aligned grains;
When considering the magnetic field’s inclination relative to the line of sight, the polarisation degree is noticeably reduced and can deviate significantly from observations. Therefore, the grain elongation must be increased to compensate for this reduction.
Finally, our model provides a promising tool for constraining the physics of grain alignment and grain evolution (GRADEPOL) using multi-wavelength dust polarisation.
Acknowledgements
The authors express gratitude to the anonymous referee for comments and corrections. The authors thank Dr. Isabelle Ristorcelli for useful comments from the early phase of this work. T.H. acknowledges the support from the main research project (No. 2025186902) from Korea Astronomy and Space Science (KASI). This work was partially supported by a grant from the Simons Foundation to IFIRSE, ICISE (916424, N.H.). The authors thank the ICISE staff for excellent support and hospitality.
References
- Abbas, M. M., Craven, P. D., Spann, J. F., et al. 2004, ApJ, 614, 781 [Google Scholar]
- Ahn, J., Xu, Z., Bang, J., et al. 2018, Phys. Rev. Lett., 121, 033603 [NASA ADS] [CrossRef] [Google Scholar]
- Aitken, D. K., Smith, C. H., & Roche, P. F. 1989, MNRAS, 236, 919 [Google Scholar]
- Alves, F. O., Frau, P., Girart, J. M., et al. 2014, A&A, 569, L1 [NASA ADS] [CrossRef] [EDP Sciences] [Google Scholar]
- Andersson, B. G., & Potter, S. B. 2010, ApJ, 720, 1045 [NASA ADS] [CrossRef] [Google Scholar]
- Andersson, B. G., Pintado, O., Potter, S. B., Straižys, V., & Charcos-Llorens, M. 2011, A&A, 534, A19 [NASA ADS] [CrossRef] [EDP Sciences] [Google Scholar]
- Andersson, B. G., Lazarian, A., & Vaillancourt, J. E. 2015, ARAA, 53, 501 [Google Scholar]
- Bethell, T. J., Chepurnov, A., Lazarian, A., & Kim, J. 2007, ApJ, 663, 1055 [NASA ADS] [CrossRef] [Google Scholar]
- Bianchi, S. 2024, A&A, 691, A330 [NASA ADS] [CrossRef] [EDP Sciences] [Google Scholar]
- Borlaff, A. S., Lopez-Rodriguez, E., Beck, R., et al. 2023, ApJ, 952, 4 [NASA ADS] [CrossRef] [Google Scholar]
- Cho, J., & Lazarian, A. 2005, ApJ, 631, 361 [Google Scholar]
- Cudlip, W., Furniss, I., King, K. J., & Jennings, R. E. 1982, MNRAS, 200, 1169 [NASA ADS] [CrossRef] [Google Scholar]
- Dolginov, A. Z., & Mitrofanov, I. G. 1976, Ap&SS, 43, 291 [NASA ADS] [CrossRef] [Google Scholar]
- Draine, B. T. 2011, Physics of the Interstellar and Intergalactic Medium [Google Scholar]
- Draine, B. 2024, ApJ, 961, 103 [NASA ADS] [CrossRef] [Google Scholar]
- Draine, B. T., & Hensley, B. S. 2021, ApJ, 909, 94 [NASA ADS] [CrossRef] [Google Scholar]
- Draine, B. T., & Weingartner, J. C. 1996, ApJ, 470, 551 [NASA ADS] [CrossRef] [Google Scholar]
- Geach, J. E., Lopez-Rodriguez, E., Doherty, M. J., et al. 2023, Nature, 621, 483 [NASA ADS] [CrossRef] [Google Scholar]
- Gerakines, P. A., Whittet, D. C. B., & Lazarian, A. 1995, ApJ, 455, L171 [Google Scholar]
- Giang, N. C., & Hoang, T. 2024, MNRAS, 530, 984 [NASA ADS] [CrossRef] [Google Scholar]
- Giang, N. C., Hoang, T., Kim, J.-G., & Tram, L. N. 2023, MNRAS, 520, 3788 [NASA ADS] [CrossRef] [Google Scholar]
- Giang, N. C., Le Gouellec, V. J. M., Hoang, T., Maury, A. J., & Hennebelle, P. 2025, ApJ, 980, 105 [Google Scholar]
- Gupta, S., Soam, A., Karoly, J., Lee, C. W., & Maheswar, G. 2025, MNRAS, 539, 3493 [Google Scholar]
- Hall, J. S. 1949, Science, 109, 166 [NASA ADS] [CrossRef] [Google Scholar]
- Hensley, B. S., & Draine, B. T. 2023, ApJ, 948, 55 [Google Scholar]
- Herranen, J., Lazarian, A., & Hoang, T. 2019, ApJ, 878, 96 [NASA ADS] [CrossRef] [Google Scholar]
- Herranen, J., Lazarian, A., & Hoang, T. 2021, ApJ, 913, 63 [NASA ADS] [CrossRef] [Google Scholar]
- Hiltner, W. A. 1949, Science, 109, 165 [NASA ADS] [CrossRef] [Google Scholar]
- Hirashita, H., & Li, Z.-Y. 2013, MNRAS, 434, L70 [CrossRef] [Google Scholar]
- Hoang, T. 2022, ApJ, 928, 102 [NASA ADS] [CrossRef] [Google Scholar]
- Hoang, T., & Lazarian, A. 2008, MNRAS, 388, 117 [NASA ADS] [CrossRef] [Google Scholar]
- Hoang, T., & Lazarian, A. 2016, ApJ, 831, 159 [Google Scholar]
- Hoang, T., & Tram, L. N. 2020, ApJ, 891, 38 [NASA ADS] [CrossRef] [Google Scholar]
- Hoang, T., & Truong, B. 2024, ApJ, 965, 183 [NASA ADS] [CrossRef] [Google Scholar]
- Hoang, T., Lazarian, A., & Martin, P. G. 2014, ApJ, 790, 6 [NASA ADS] [CrossRef] [Google Scholar]
- Hoang, T., Lazarian, A., & Andersson, B. G. 2015, MNRAS, 448, 1178 [NASA ADS] [CrossRef] [Google Scholar]
- Hoang, T., Tram, L. N., Lee, H., & Ahn, S.-H. 2019, Nat. Astron., 3, 766 [Google Scholar]
- Hoang, T., Tram, L. N., Lee, H., Diep, P. N., & Ngoc, N. B. 2021, ApJ, 908, 218 [NASA ADS] [CrossRef] [Google Scholar]
- Hoang, T., Tram, L. N., Minh Phan, V. H., et al. 2022, AJ, 164, 248 [NASA ADS] [CrossRef] [Google Scholar]
- Holgate, J. T., Simons, L., Andrew, Y., & Stavrou, C. K. 2019, Europhys. Lett., 127, 45004 [NASA ADS] [CrossRef] [Google Scholar]
- Hull, C. L. H., Plambeck, R. L., Kwon, W., et al. 2014, ApJS, 213, 13 [NASA ADS] [CrossRef] [Google Scholar]
- Ivlev, A. V., Silsbee, K., Sipilä, O., & Caselli, P. 2019, ApJ, 884, 176 [Google Scholar]
- Jekel, C. F., & Venter, G. 2019, pwlf: A Python Library for Fitting 1D Continuous Piecewise Linear Functions [Google Scholar]
- Jones, T. J., Bagley, M., Krejny, M., Andersson, B. G., & Bastien, P. 2015, AJ, 149, 31 [Google Scholar]
- Kandori, R., Nagata, T., Tazaki, R., et al. 2018, ApJ, 868, 94 [Google Scholar]
- Kandori, R., Tomisaka, K., Saito, M., et al. 2020, ApJ, 888, 120 [Google Scholar]
- Lazarian, A., & Hoang, T. 2007, MNRAS, 378, 910 [Google Scholar]
- Lazarian, A., & Hoang, T. 2008, ApJ, 676, L25 [CrossRef] [Google Scholar]
- Lazarian, A., & Hoang, T. 2021, ApJ, 908, 12 [NASA ADS] [CrossRef] [Google Scholar]
- Lee, H., Hoang, T., Le, N., & Cho, J. 2020, ApJ, 896, 44 [Google Scholar]
- Mathis, J. S., & Whiffen, G. 1989, ApJ, 341, 808 [Google Scholar]
- Mathis, J. S., Mezger, P. G., & Panagia, N. 1983, A&A, 500, 259 [NASA ADS] [Google Scholar]
- Mocz, P., Burkhart, B., Hernquist, L., McKee, C. F., & Springel, V. 2017, ApJ, 838, 40 [Google Scholar]
- Myers, P. C., Basu, S., & Auddy, S. 2018, ApJ, 868, 51 [Google Scholar]
- Ngoc, N. B., Hoang, T., Diep, P. N., & Tram, L. N. 2024, ApJ, 974, 118 [Google Scholar]
- Padovani, M., Brinch, C., Girart, J. M., et al. 2012, A&A, 543, A16 [NASA ADS] [CrossRef] [EDP Sciences] [Google Scholar]
- Pattle, K., Fissel, L., Tahani, M., Liu, T., & Ntormousi, E. 2023, in Astronomical Society of the Pacific Conference Series, 534, Astronomical Society of the Pacific Conference Series, eds. S. Inutsuka, Y. Aikawa, T. Muto, K. Tomida, & M. Tamura, 193 [Google Scholar]
- Planck Collaboration 2020, A&A, 641, A4 [NASA ADS] [CrossRef] [EDP Sciences] [Google Scholar]
- Reimann, R., Doderer, M., Hebestreit, E., et al. 2018, Phys. Rev. Lett., 121, 033602 [NASA ADS] [CrossRef] [Google Scholar]
- Reissl, S., Guillet, V., Brauer, R., et al. 2020, A&A, 640, A118 [NASA ADS] [CrossRef] [EDP Sciences] [Google Scholar]
- Reissl, S., Nguyen, P., Jordan, L. M., & Klessen, R. S. 2024, A&A, 692, A60 [NASA ADS] [CrossRef] [EDP Sciences] [Google Scholar]
- Spitzer, L. J., & McGlynn, T. A. 1979, ApJ, 231, 417 [NASA ADS] [CrossRef] [Google Scholar]
- Thang, N. T., Diep, P. N., Hoang, T., et al. 2024, ApJ, 970, 114 [Google Scholar]
- Tielens, A. 1989, in IAU Symposium, Vol. 135, Interstellar Dust, eds. L. J. Allamandola, & A. G. G. M. Tielens, 239 [Google Scholar]
- Tram, L. N., & Hoang, T. 2022, Front. Astron. Space Sci., 9, 923927 [NASA ADS] [CrossRef] [Google Scholar]
- Tram, L. N., Hoang, T., Soam, A., Lesaffre, P., & Reach, W. T. 2020, ApJ, 893, 138 [Google Scholar]
- Tram, L. N., Hoang, T., Lee, H., et al. 2021a, ApJ, 906, 115 [Google Scholar]
- Tram, L. N., Lee, H., Hoang, T., et al. 2021b, ApJ, 908, 159 [Google Scholar]
- Tram, L. N., Hoang, T., Wiesemeyer, H., et al. 2024, A&A, 689, A290 [NASA ADS] [CrossRef] [EDP Sciences] [Google Scholar]
- Truong, B., & Hoang, T. 2025, ApJ, 981, 83 [Google Scholar]
- Vaillancourt, J. E., Andersson, B. G., Clemens, D. P., et al. 2020, ApJ, 905, 157 [NASA ADS] [CrossRef] [Google Scholar]
- van Holstein, R. G., Stolker, T., Jensen-Clem, R., et al. 2021, A&A, 647, A21 [EDP Sciences] [Google Scholar]
- Weintraub, D. A., Goodman, A. A., & Akeson, R. L. 2000, in Protostars and Planets IV, eds. V. Mannings, A. P. Boss, & S. S. Russell, 247 [Google Scholar]
- Whittet, D. C. B., Hough, J. H., Lazarian, A., & Hoang, T. 2008, ApJ, 674, 304 [Google Scholar]
- Whitworth, A. P., & Ward-Thompson, D. 2001, ApJ, 547, 317 [Google Scholar]
- Wright, C. M., Aitken, D. K., Smith, C. H., Roche, P. F., & Laureijs, R. J. 2002, in The Origin of Stars and Planets: The VLT View, eds. J. F. Alves, & M. J. McCaughrean, 85 [Google Scholar]
Appendix A Models and observations in Pipe-109
Figure A.1 illustrates the comparison between our model and observations of Pipe-109, similar to Figure 8, using the same grain elongation for the three bands. In the centre of the cloud, the model fails to explain the observations at 870 μm even with a relatively large grain size of 3 μm, indicating that more elongated grains are required. Therefore, we show the values of pem predicted by our model with an axial ratio of 2, instead of 1.4 as used for the starlight pext in Figure 8.
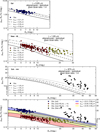 |
Fig. A.1 Similar to Figure 8 but using the grains with an axial ratio of 1.4 for all bands. Our model is unable to reproduce the degree of thermal dust polarisation at 870 μm. |
There was a typo in Tram et al. (2020) missing the factor nh in the writing, but the calculation took this factor into account.
If the cloud is fully molecular, one gets n(H2) = nh/2.
The values of  are determined by a piecewise linear fitting using the PWLF-library (Jekel & Venter 2019). We use −0.9 as a criterion.
All Tables
All Figures
|
Fig. 1 Coordinate system of the starless core on the (x,z)-plane with the ẑ direction towards the observer. The position in the plane of the sky is defined by r0. Each line of sight, ŝ, corresponds to a distinct visual extinction, AV, calculated from the gas volume density profile along this direction. At a location ri on the sight line, the physical parameters (such as gas density, temperature, and radiation field) are assumed to be uniform on the dashed circle. |
| In the text | |
|
Fig. 2 Top panel: full map on the plane of the sky (x̂ŷ plane) of the line-of-sight visual extinction. Bottom panel: alignment size along the line of sight (x̂ẑ plane). We adopt n0 = 5 × 105 cm-3, rflat = 0.024 pc, α = 2, U0 = 1, γ = 0.3, oblate grains (axial ratio of 1.4) with amax = 1 μm, β = -3.5, and fmax = 1. This setup mimics the scale of the Pipe-109 starless core, whose data will be used later in this work. |
| In the text | |
|
Fig. 3 Polarisation spectrum pext/AV vs. λ of starlight dust polarisation for different lines of sight (AV), shown for maximum grain sizes of 0.25 μm (left panel) and 0.5 μm (right panel). For λ ≤ 10 μm, the spectral feature is broader for larger maximum grain size. When AV is low, smaller amax yields a greater amplitude; however, this relationship inverts as AV increases. The oblate grains with an axial ratio of 1.4 are adopted. |
| In the text | |
|
Fig. 4 Relation between p/AV and AV for starlight polarisation at optical wavelength (R band, left panel) and near-IR (H band, right panel) wavelengths. Different lines represent different maximum grain sizes. The dots mark locations where the slope changes from <−1 to ≃−1. A slope of −1 indicates the complete loss of grain alignment. |
| In the text | |
|
Fig. 5 Left panel: relation between |
| In the text | |
|
Fig. 6 Polarisation spectrum of thermal dust polarisation towards a starless core for different values of the line-of-sight visual extinction ( |
| In the text | |
|
Fig. 7 Same as in Figure 4. Relation between pem and AV at 870 μm for different maximum grain sizes. The grey line shows a slope of −1, indicating a total loss of grain alignment. Smaller grains quickly lose their alignment within the cloud (left panel). If the grains are sufficiently large, the alignment is more efficient at the same AV, resulting in shallower slopes. |
| In the text | |
|
Fig. 8 Comparison of pext/AV and pem vs. AV from our model and the data of Pipe-109. In the optical (first row) and near-IR (second row) wavelengths, we plot pext/AV (alignment efficiency) against AV, while for the submm wavelength (third row), we use pem versus AV. The fourth row combines all datasets above, with a shaded region indicating the range of amax that covers the data shown in the above panels. The grain axial ratio at 870 μm is set to 2 because the value of 1.4 used at other wavelengths (as shown in Figure A.1) is too low. Polarisation data are adapted from Alves et al. (2014) and references therein. |
| In the text | |
|
Fig. 9 Similar to Figure 8, but here polarisation is calculated for different grain elongations, while keeping maximum grain sizes constant, namely 0.21, 0.28, and 1.25 μm. For near-IR and submm data with AV > 14 mag, even at an axial ratio of 3, the model fails to cover all data points, indicating the need for larger grains, as shown in Figure 8. For optical and near-IR data with AV ≤ 14 mag, the models fit well. |
| In the text | |
|
Fig. 10 Similar to Figures 8 and 9, but showing the pem - I relationships for thermal dust polarization at 870 μm. Our models nicely reproduce the observations. Data are taken from the public data file in Alves et al. (2014). |
| In the text | |
|
Fig. 11 Polarisation spectrum in absorption (top panel) and emission (bottom panel) for a maximum grain size amax = 0.5 μm with different axial ratios, of 1.4 and 3. The more elongated the grain, the higher the degree of polarisation. |
| In the text | |
|
Fig. A.1 Similar to Figure 8 but using the grains with an axial ratio of 1.4 for all bands. Our model is unable to reproduce the degree of thermal dust polarisation at 870 μm. |
| In the text | |
Current usage metrics show cumulative count of Article Views (full-text article views including HTML views, PDF and ePub downloads, according to the available data) and Abstracts Views on Vision4Press platform.
Data correspond to usage on the plateform after 2015. The current usage metrics is available 48-96 hours after online publication and is updated daily on week days.
Initial download of the metrics may take a while.