Fig. 5
Download original image
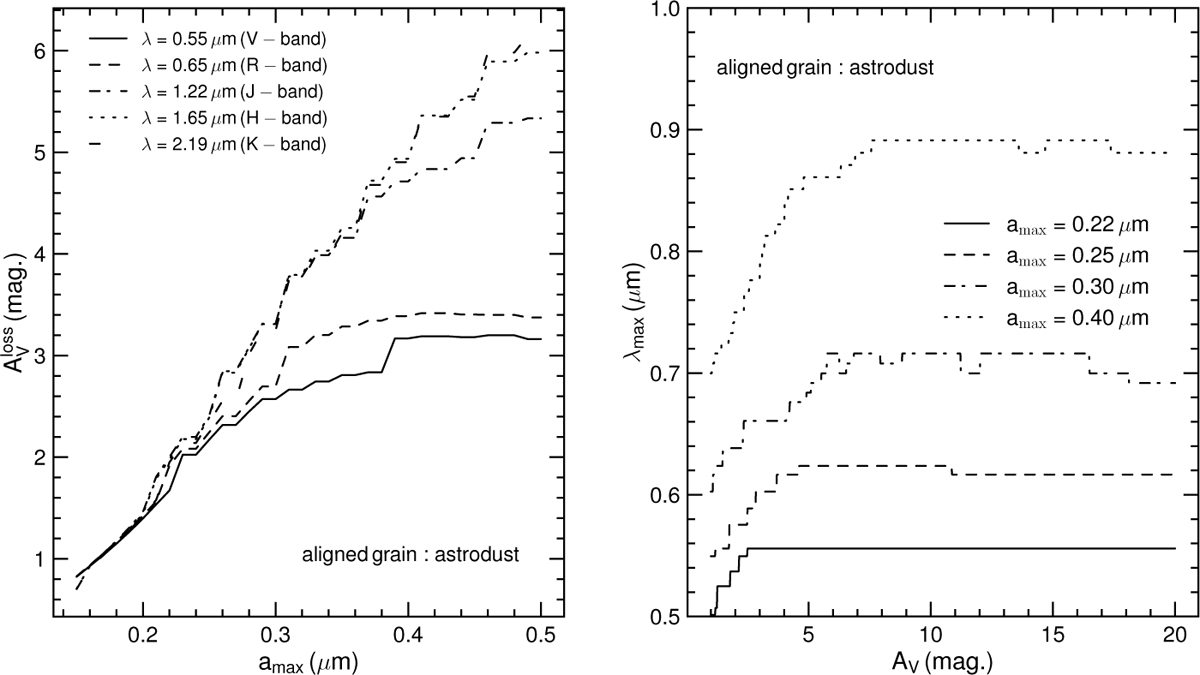
Left panel: relation between ![]() , where the grain completely loses its alignment, and maximum grain size. This plot is shown for several commonly used wavelengths from optical to near-IR. Right panel: relationship between the wavelength of peak starlight polarisation, λmax, and AV. The value of λmax increases initially and then remains steady as AV increases.
, where the grain completely loses its alignment, and maximum grain size. This plot is shown for several commonly used wavelengths from optical to near-IR. Right panel: relationship between the wavelength of peak starlight polarisation, λmax, and AV. The value of λmax increases initially and then remains steady as AV increases.
Current usage metrics show cumulative count of Article Views (full-text article views including HTML views, PDF and ePub downloads, according to the available data) and Abstracts Views on Vision4Press platform.
Data correspond to usage on the plateform after 2015. The current usage metrics is available 48-96 hours after online publication and is updated daily on week days.
Initial download of the metrics may take a while.