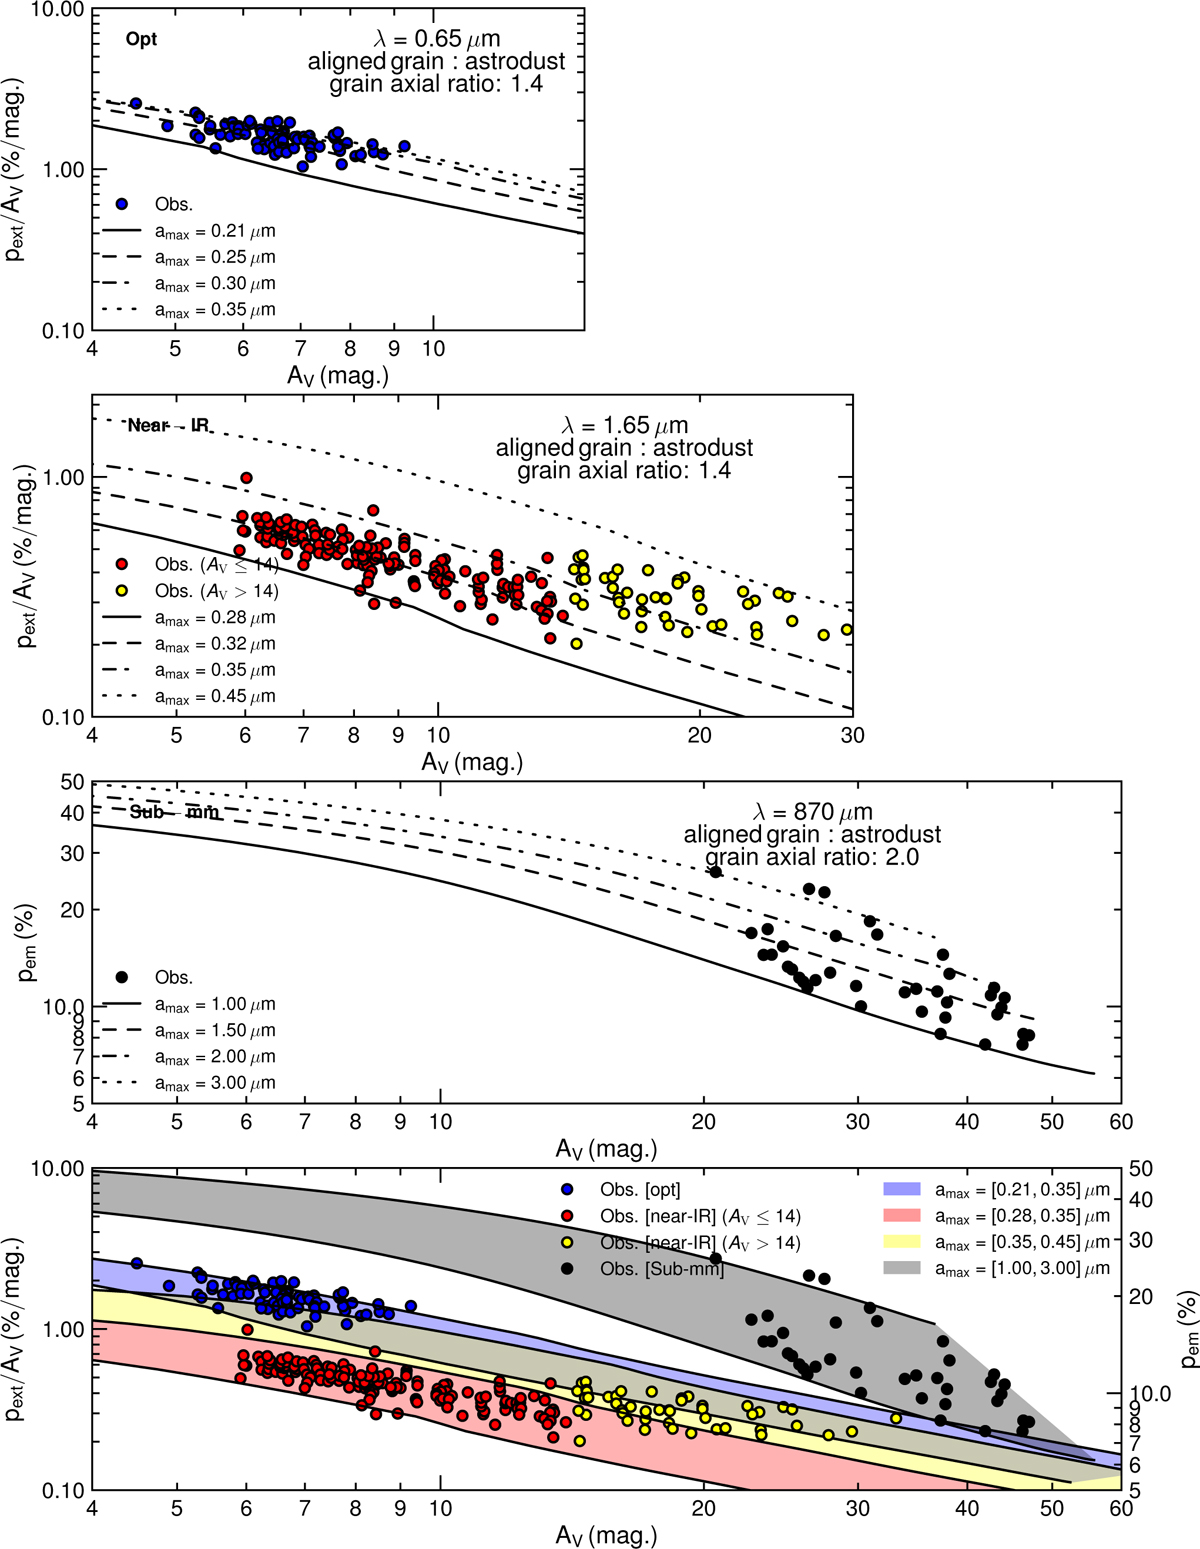
Fig. 8
Download original image
Comparison of pext/AV and pem vs. AV from our model and the data of Pipe-109. In the optical (first row) and near-IR (second row) wavelengths, we plot pext/AV (alignment efficiency) against AV, while for the submm wavelength (third row), we use pem versus AV. The fourth row combines all datasets above, with a shaded region indicating the range of amax that covers the data shown in the above panels. The grain axial ratio at 870 μm is set to 2 because the value of 1.4 used at other wavelengths (as shown in Figure A.1) is too low. Polarisation data are adapted from Alves et al. (2014) and references therein.
Current usage metrics show cumulative count of Article Views (full-text article views including HTML views, PDF and ePub downloads, according to the available data) and Abstracts Views on Vision4Press platform.
Data correspond to usage on the plateform after 2015. The current usage metrics is available 48-96 hours after online publication and is updated daily on week days.
Initial download of the metrics may take a while.