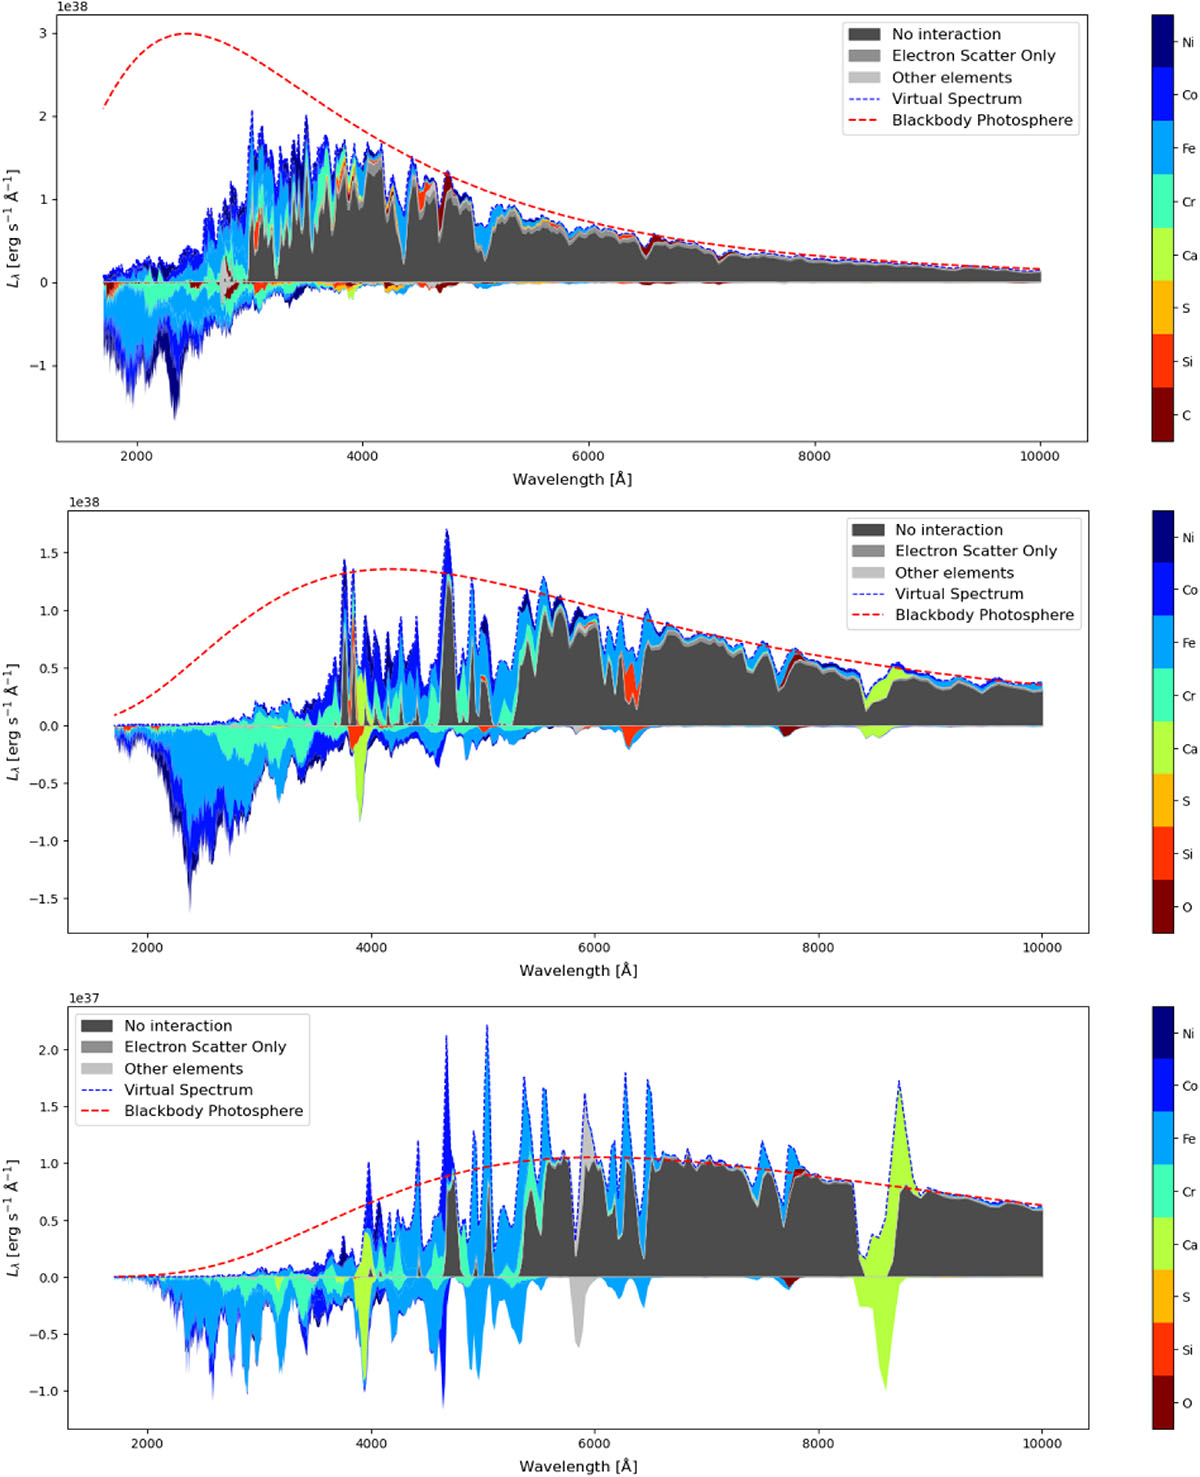
Fig. 10.
Download original image
The spectral decomposition (SDEC) plots of SN 2022xlp at texp = 6.0 days (top), texp = 19.0 days (middle) and texp = 73.0 days (bottom). The figures show the synthetic model spectrum and also the contribution of various light-matter interactions and elements to the spectrum, indicating how much they add or subtract from the spectral luminosity density at different wavelengths. The red dashed line represents the Planck curve corresponding to the photospheric temperature.
Current usage metrics show cumulative count of Article Views (full-text article views including HTML views, PDF and ePub downloads, according to the available data) and Abstracts Views on Vision4Press platform.
Data correspond to usage on the plateform after 2015. The current usage metrics is available 48-96 hours after online publication and is updated daily on week days.
Initial download of the metrics may take a while.