Open Access
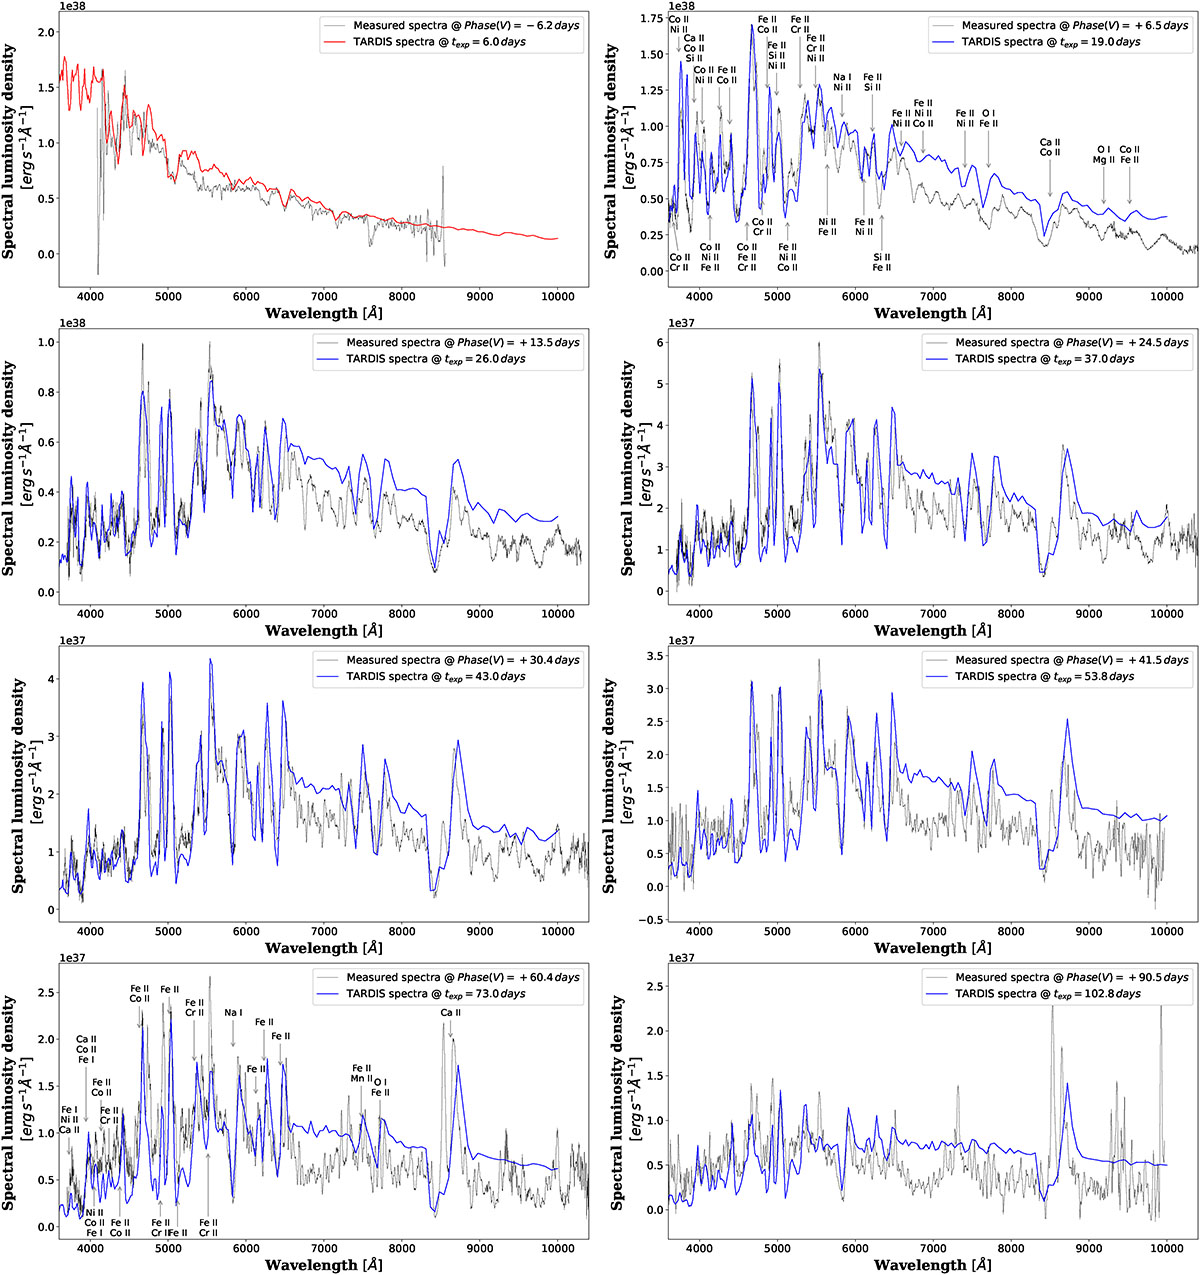
Fig. 9.
Download original image
Spectra time series fittings of SN 2022xlp with TARDIS-synthesised model spectra. The figure also shows the identified spectral lines at the two highlighted epochs: a post- and near maximum and a late-phase spectrum. The phase relative to the V-band maximum and the time since the explosion are also marked.
Current usage metrics show cumulative count of Article Views (full-text article views including HTML views, PDF and ePub downloads, according to the available data) and Abstracts Views on Vision4Press platform.
Data correspond to usage on the plateform after 2015. The current usage metrics is available 48-96 hours after online publication and is updated daily on week days.
Initial download of the metrics may take a while.