Fig. 10
Download original image
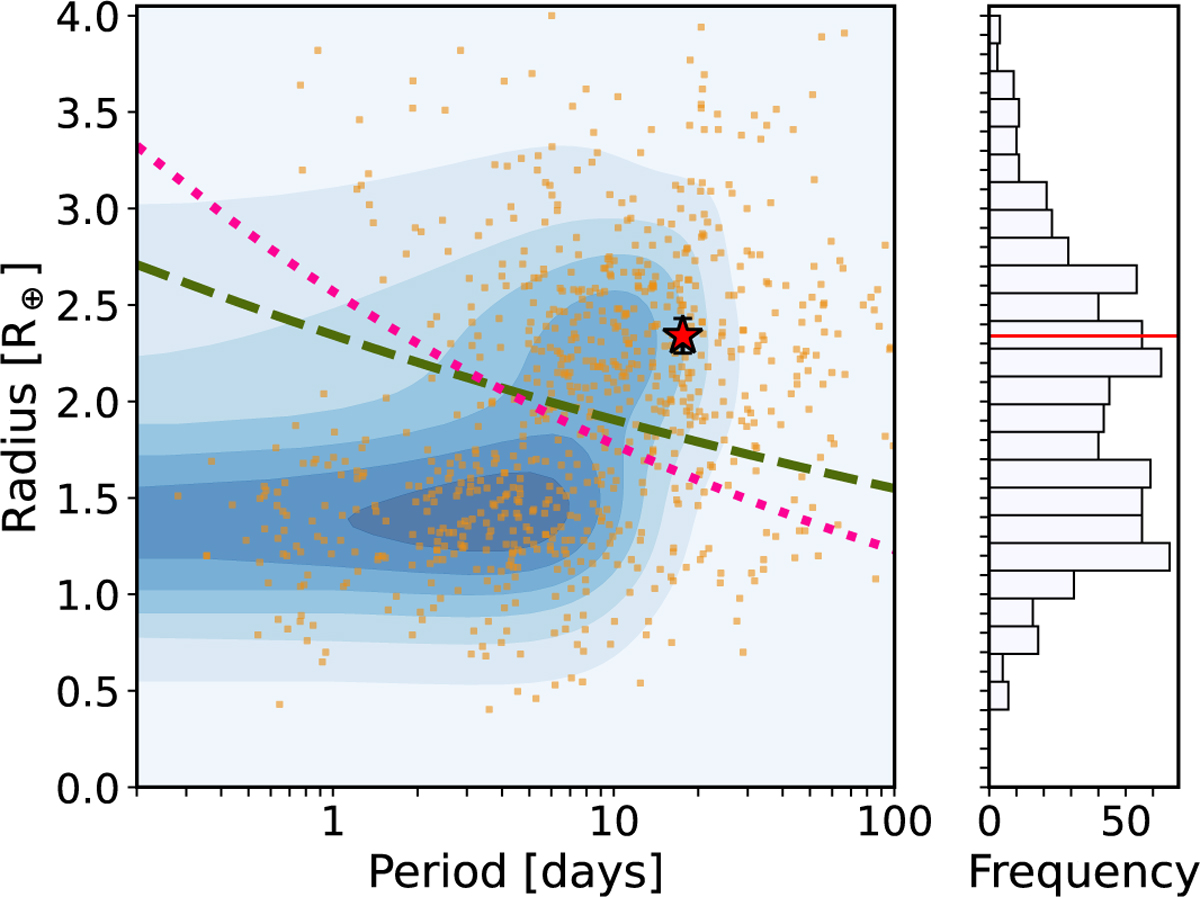
Period-radius diagram for small planets (Rp < 4 R⊕) around K-type stars (4000 K < Teff < 5300 K). The shaded blue area represents a Gaussian kernel density estimation of the points. The position of TOI-283 b is marked by the red star. The dashed olive line shows the position of the radius gap from Van Eylen et al. (2018), while the dotted pink line shows the position of the gap from Venturini et al. (2024). The data were taken from the NASA Exoplanet Archive (https://exoplanetarchive.ipac.caltech.edu/).
Current usage metrics show cumulative count of Article Views (full-text article views including HTML views, PDF and ePub downloads, according to the available data) and Abstracts Views on Vision4Press platform.
Data correspond to usage on the plateform after 2015. The current usage metrics is available 48-96 hours after online publication and is updated daily on week days.
Initial download of the metrics may take a while.