Fig. A.2
Download original image
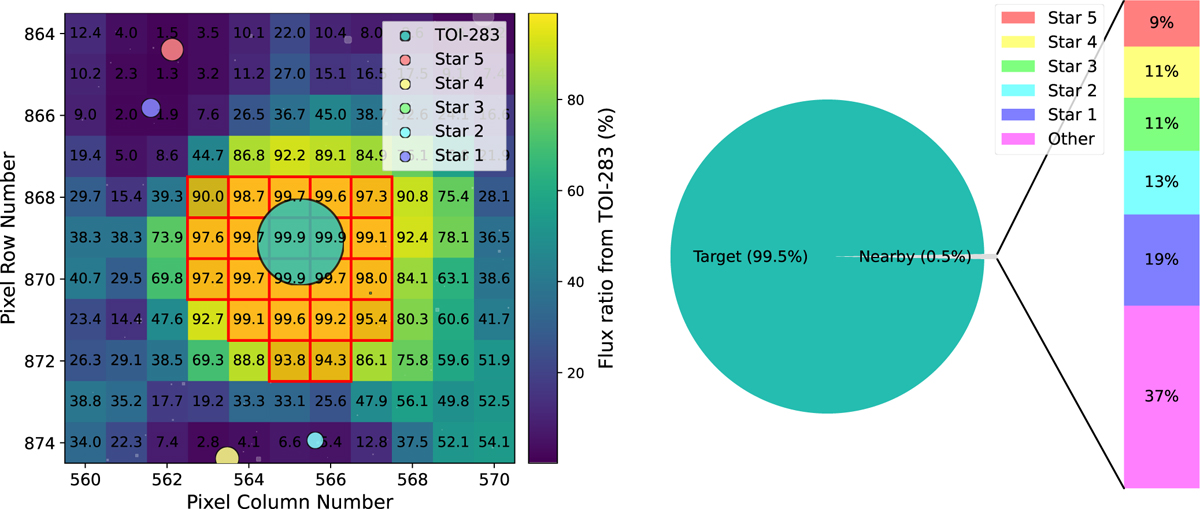
Nearby sources contributing to the TESS photometry TOI-283. Left: TPF-shaped heatmap with the pixel-by-pixel flux fraction from TOI-283 in S1. The red grid is the SPOC aperture. The white disks represent all the Gaia sources, and the five sources that most contribute to the aperture flux are highlighted in different colours. Disk areas scale with the emitted fluxes. Right: Flux contributions to the SPOC aperture. ‘Other’ refers to the total contamination from nearby Gaia DR2 sources that contribute less than Star 5.
Current usage metrics show cumulative count of Article Views (full-text article views including HTML views, PDF and ePub downloads, according to the available data) and Abstracts Views on Vision4Press platform.
Data correspond to usage on the plateform after 2015. The current usage metrics is available 48-96 hours after online publication and is updated daily on week days.
Initial download of the metrics may take a while.