Fig. 2
Download original image
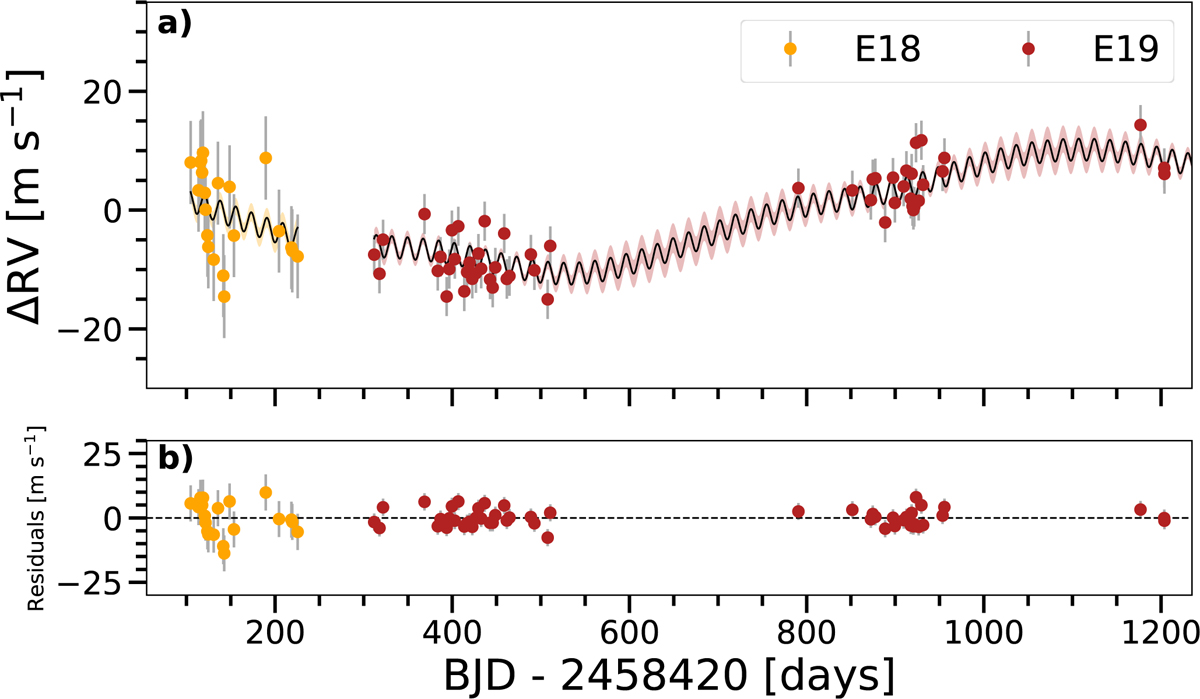
TOI-283 b RV measurements taken with ESPRESSO. Panel a: RV time series and best-fitting model. The best-fitting model was computed using the median values of the posterior distribution of the fit parameters; the shaded area represents the 1σ uncertainty limits of the best-fitting model. Panel b: residuals of the fit after subtracting the single-planet Keplerian model. The uncertainties shown here include the RV jitter values (added in quadrature) for each set.
Current usage metrics show cumulative count of Article Views (full-text article views including HTML views, PDF and ePub downloads, according to the available data) and Abstracts Views on Vision4Press platform.
Data correspond to usage on the plateform after 2015. The current usage metrics is available 48-96 hours after online publication and is updated daily on week days.
Initial download of the metrics may take a while.