Open Access
Fig. 4
Download original image
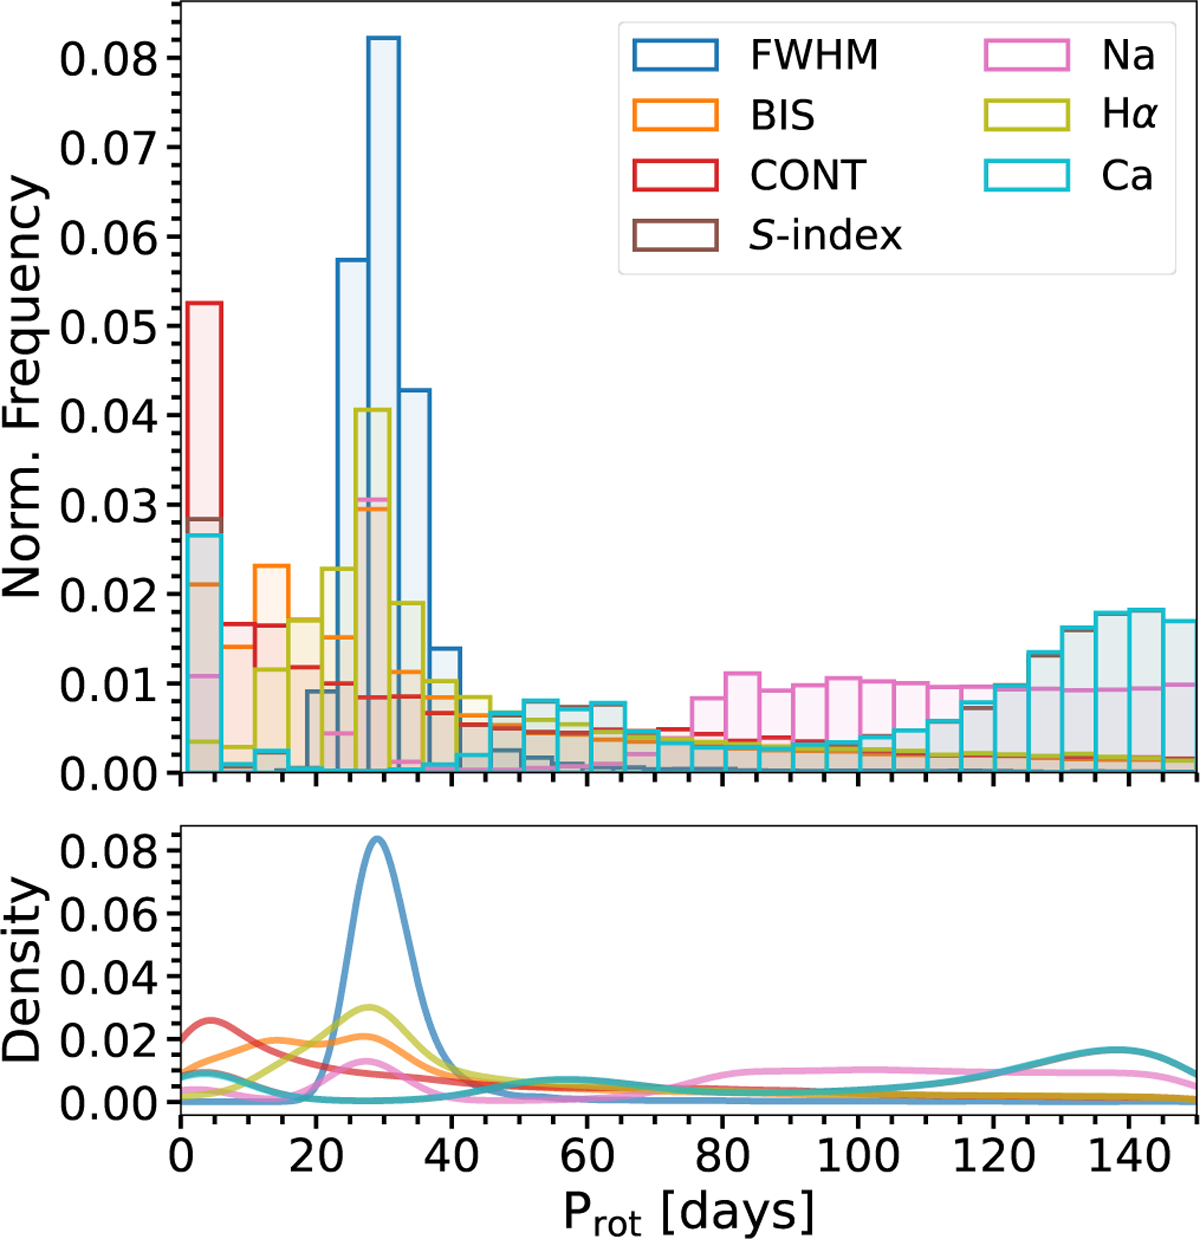
Stellar rotation from activity indices. Top panel: histograms of the posterior distribution of the fit rotation period for the ESPRESSO activity indices. Bottom panel: kernel density estimation of the posterior distributions.
Current usage metrics show cumulative count of Article Views (full-text article views including HTML views, PDF and ePub downloads, according to the available data) and Abstracts Views on Vision4Press platform.
Data correspond to usage on the plateform after 2015. The current usage metrics is available 48-96 hours after online publication and is updated daily on week days.
Initial download of the metrics may take a while.