Fig. 5
Download original image
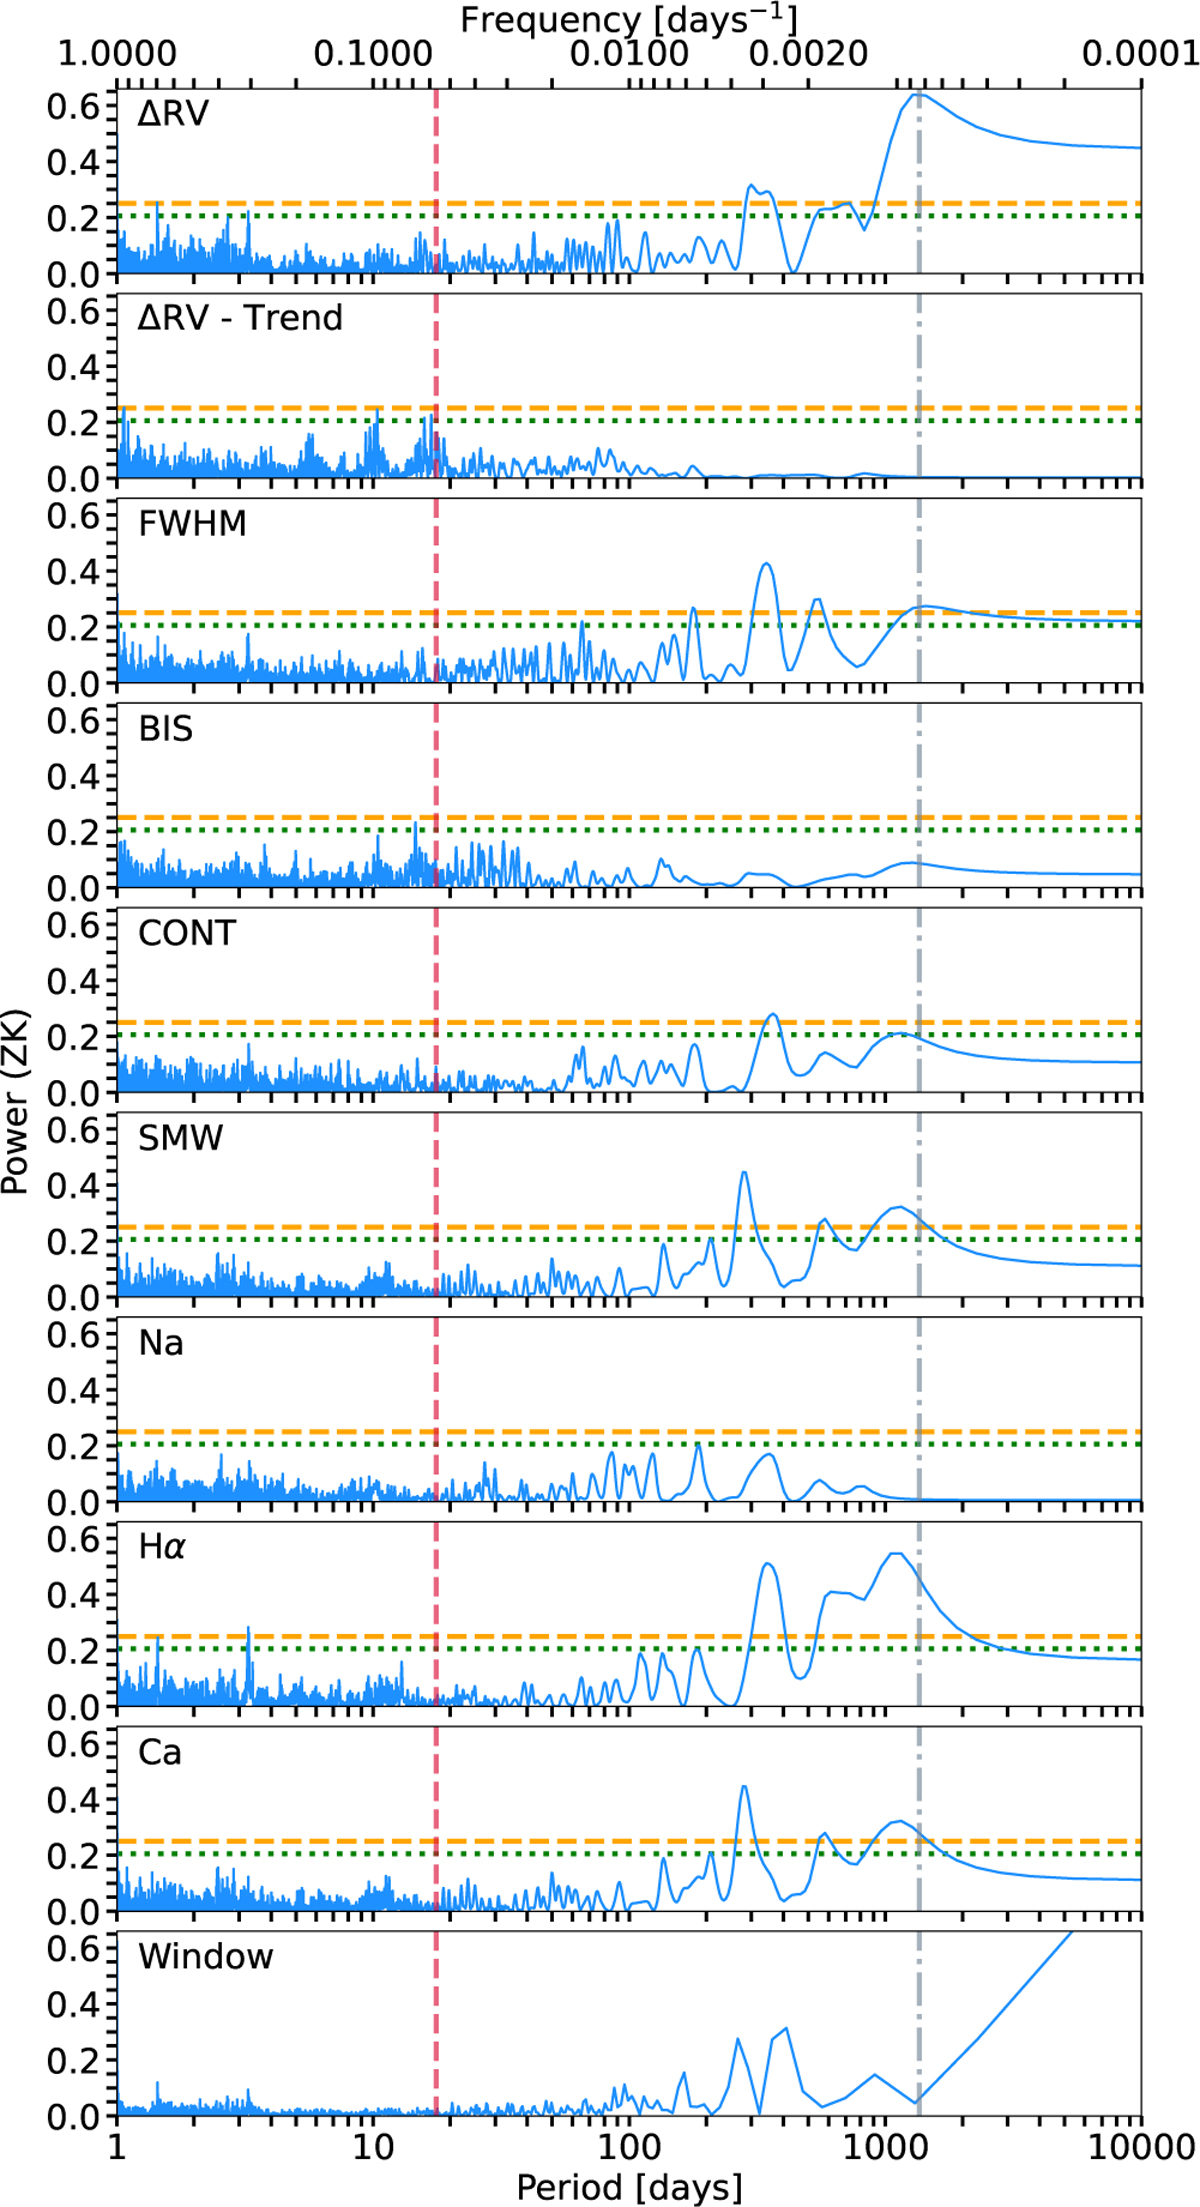
GLS periodograms of the ESPRESSO RVs, activity indices, and the observational window function. The RV and activity index values were median-subtracted for each dataset before (E18) and after (E19) the June–July 2019 intervention. Horizontal lines indicate the FAP levels at 10% (dash-dotted green line) and 1% (dashed orange line). The vertical dotted red line marks the orbital period of TOI-283 b (P = 17.61745 days), while the vertical dash-dotted gray line indicates the period of the long-term signal (P = 1356 days; see Sect. 5.4).
Current usage metrics show cumulative count of Article Views (full-text article views including HTML views, PDF and ePub downloads, according to the available data) and Abstracts Views on Vision4Press platform.
Data correspond to usage on the plateform after 2015. The current usage metrics is available 48-96 hours after online publication and is updated daily on week days.
Initial download of the metrics may take a while.