Fig. 6
Download original image
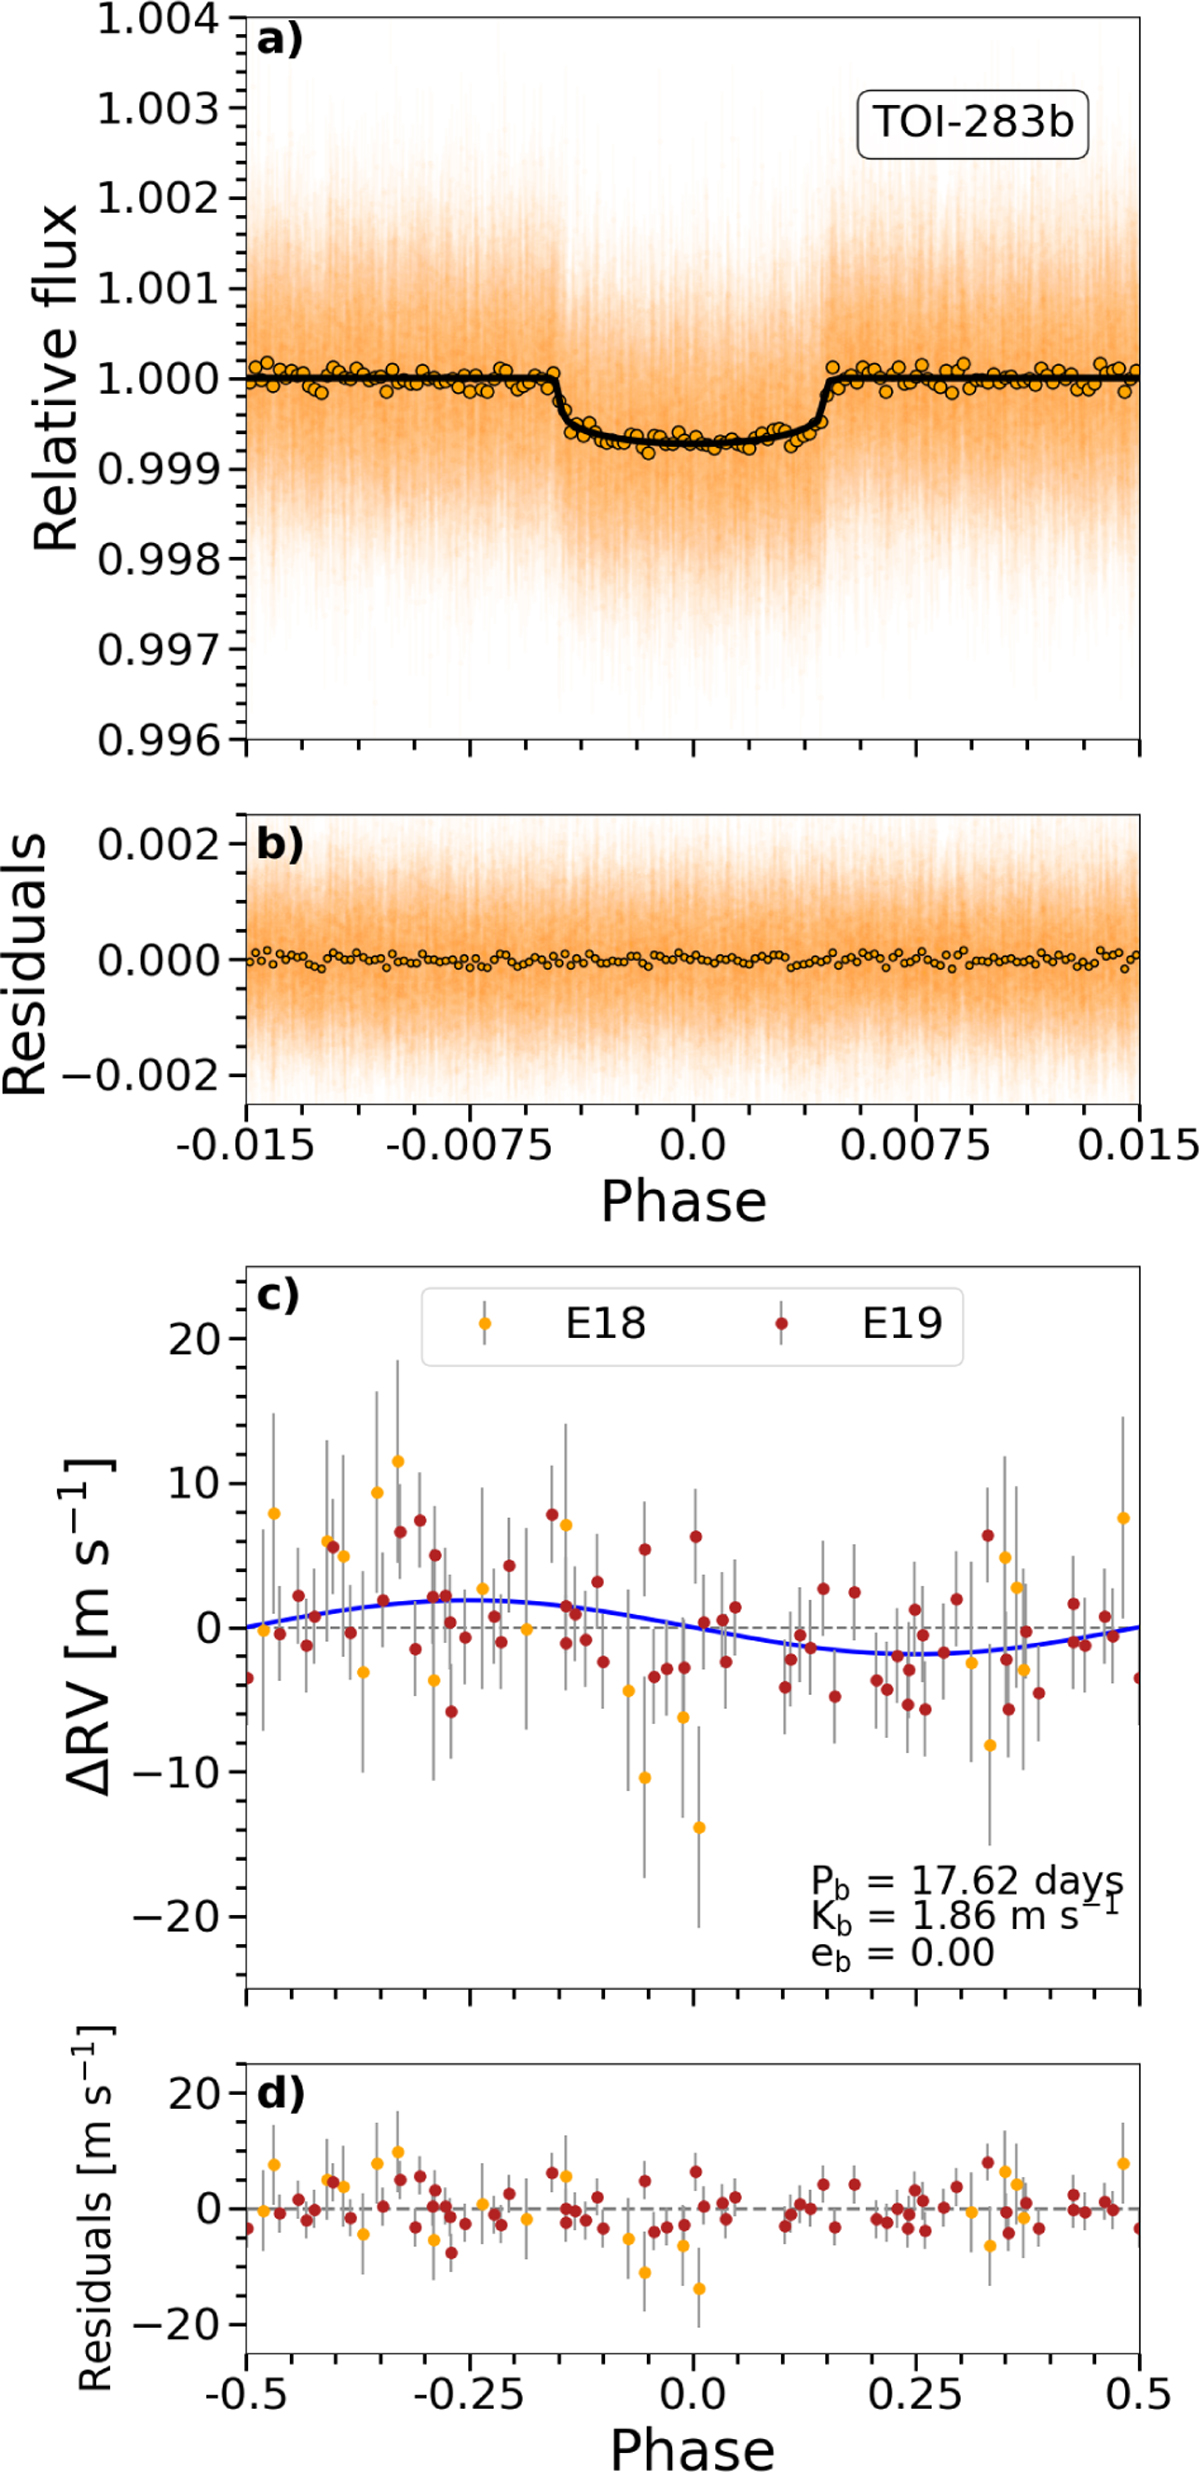
TESS and ESPRESSO phase-folded data of TOI-283 b. Panel a: TOI-283 b phase-folded TESS light curve after subtracting the photometric variations from the time series. The best-fit transit model is shown in black. The circles are TESS binned observations. Panel b: residuals of the transit fit. Panel c: ESPRESSO phase-folded RV measurements and best fit (blue line) after subtracting the quadratic trend and red-noise component. Panel d: residuals of the RV fit.
Current usage metrics show cumulative count of Article Views (full-text article views including HTML views, PDF and ePub downloads, according to the available data) and Abstracts Views on Vision4Press platform.
Data correspond to usage on the plateform after 2015. The current usage metrics is available 48-96 hours after online publication and is updated daily on week days.
Initial download of the metrics may take a while.