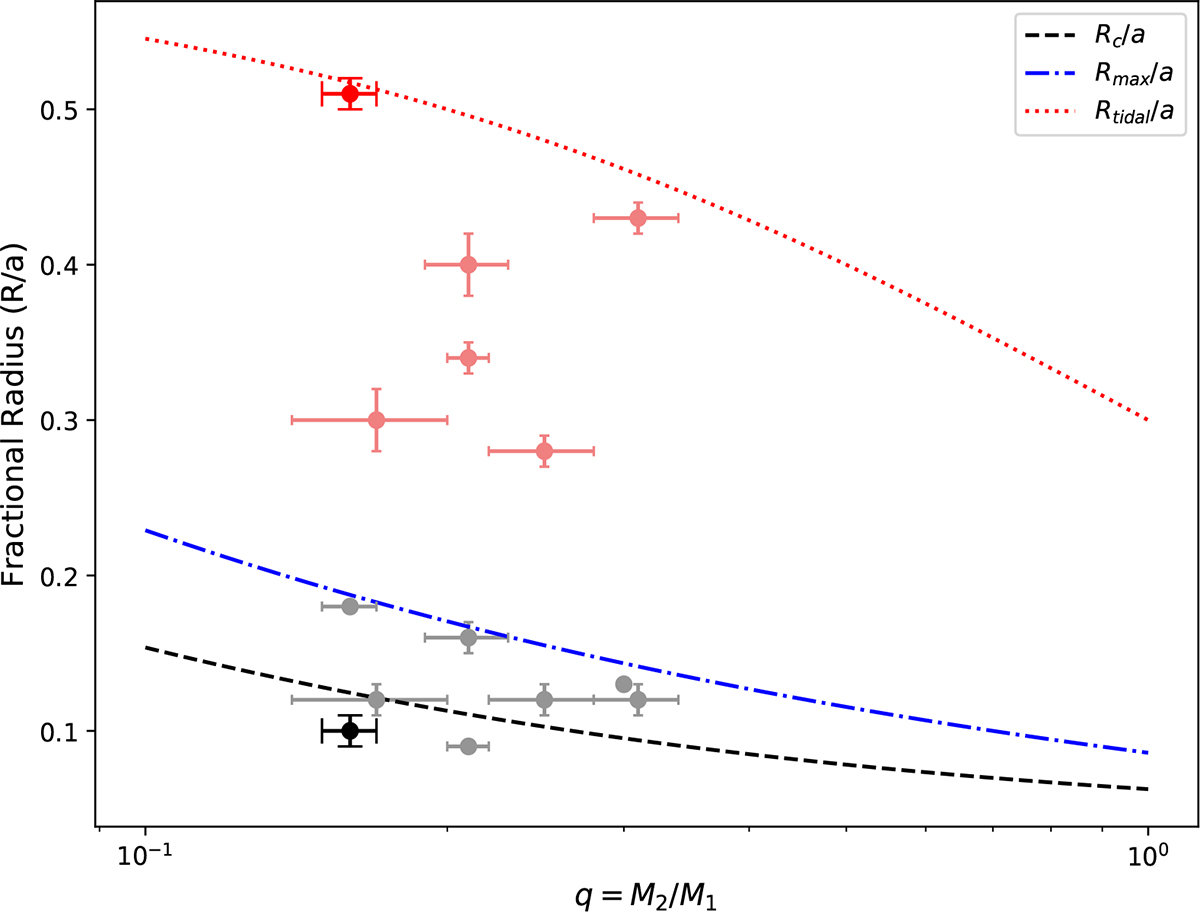
Fig. 12.
Download original image
Relative radius for the Gainer R1/a (black dot) and disk (Rd/a (red dot) of V1001 Cen, the gray dots are other DPVs extracted from Table 12 of Mennickent et al. (2016a), and the pink dots represent their disks. Below the circularization radius shown by the dashed black line a disk should form and below the dashed blue line a disk could form. The tidal radius indicates the maximum possible extent of the disk.
Current usage metrics show cumulative count of Article Views (full-text article views including HTML views, PDF and ePub downloads, according to the available data) and Abstracts Views on Vision4Press platform.
Data correspond to usage on the plateform after 2015. The current usage metrics is available 48-96 hours after online publication and is updated daily on week days.
Initial download of the metrics may take a while.