Fig. 18.
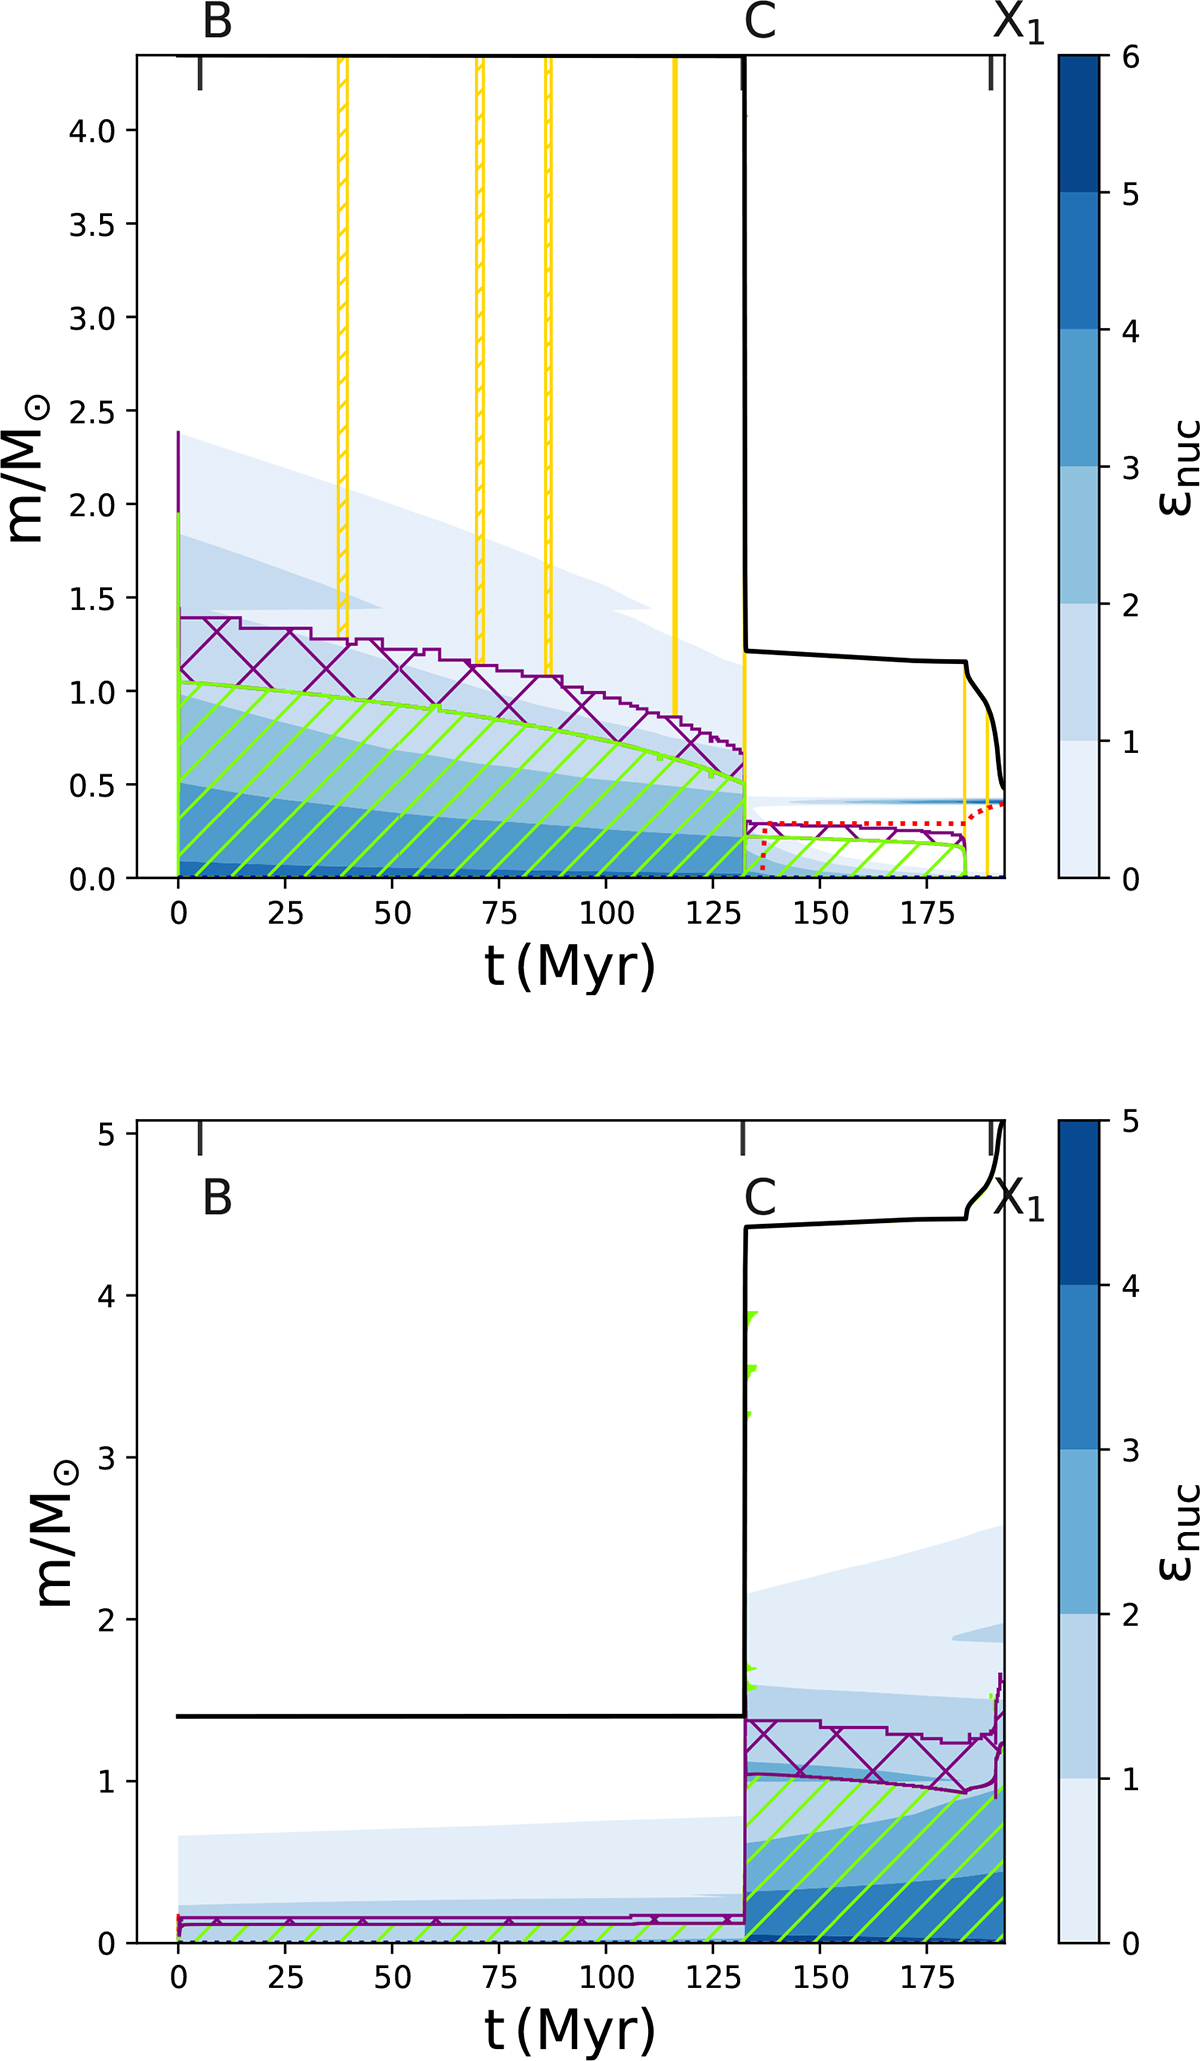
Download original image
Kippenhahn plots derived from the MESA model with conservative mass transfer for V1001 Cen. At the top we see graph donor star and below gainer star for a conservative model of initial mass of 4.4 and 1.4 M/M⊙ and initial orbital period of 2.1 days. In the graphical representation, the x axis displays the age since hydrogen ignition in units of million years (Myr), and the different stellar layers are identified by their mass proportions (M/M⊙). Each mixing process is illustrated with specific colors and patterns: convective mixing is represented in green with a hatching pattern, semi convective mixing in red, convective overshooting mixing with a crosshatched pattern in purple, and thermohaline mixing in yellow with a hatching pattern. The solid black line indicates the surface of each star, and the brown zones correspond to rotational mixing.
Current usage metrics show cumulative count of Article Views (full-text article views including HTML views, PDF and ePub downloads, according to the available data) and Abstracts Views on Vision4Press platform.
Data correspond to usage on the plateform after 2015. The current usage metrics is available 48-96 hours after online publication and is updated daily on week days.
Initial download of the metrics may take a while.