Open Access
Fig. 9.
Download original image
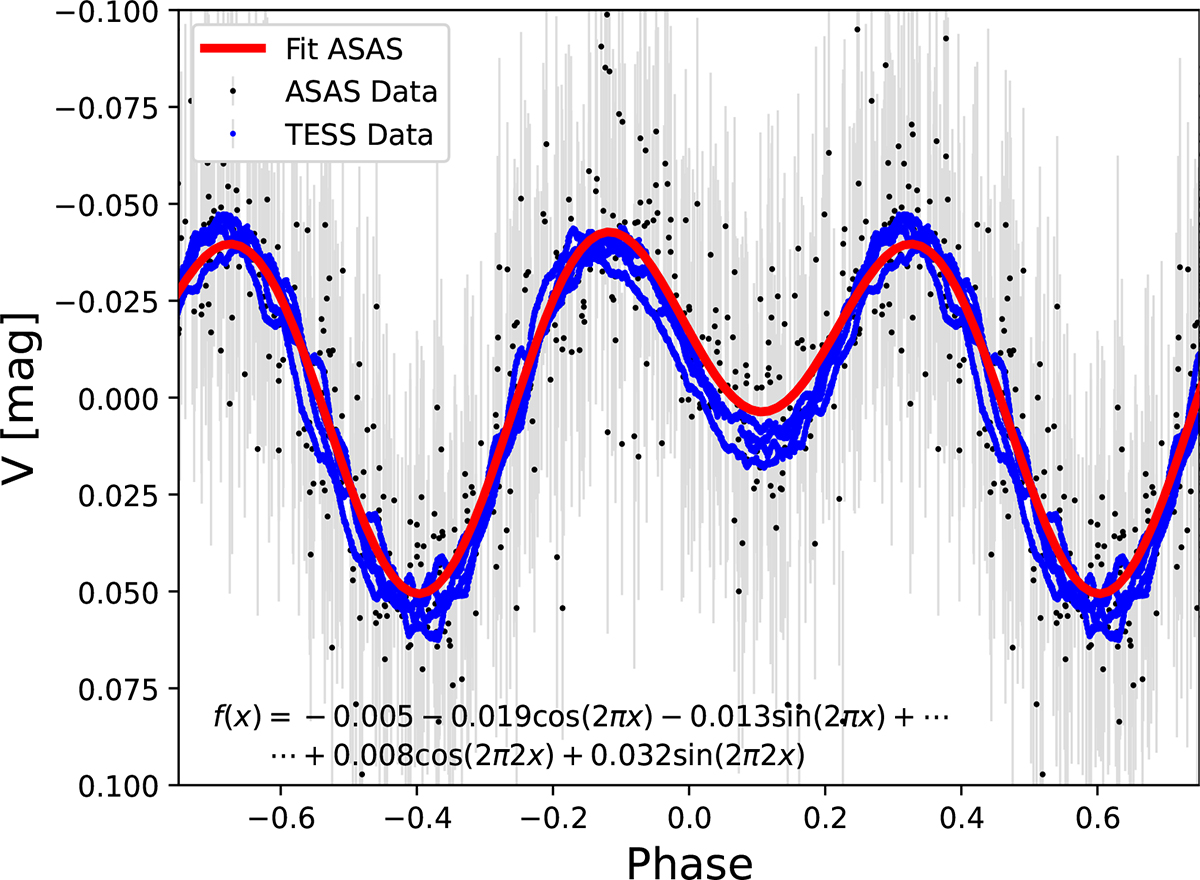
Light curve of V1001 Cen derived from ASAS data (black points) and TESS data (blue points). The red line corresponds to a Fourier series fit to the ASAS data. A good agreement is observed between the fit function and the TESS photometry, indicating consistency between both datasets.
Current usage metrics show cumulative count of Article Views (full-text article views including HTML views, PDF and ePub downloads, according to the available data) and Abstracts Views on Vision4Press platform.
Data correspond to usage on the plateform after 2015. The current usage metrics is available 48-96 hours after online publication and is updated daily on week days.
Initial download of the metrics may take a while.