Fig. B.1
Download original image
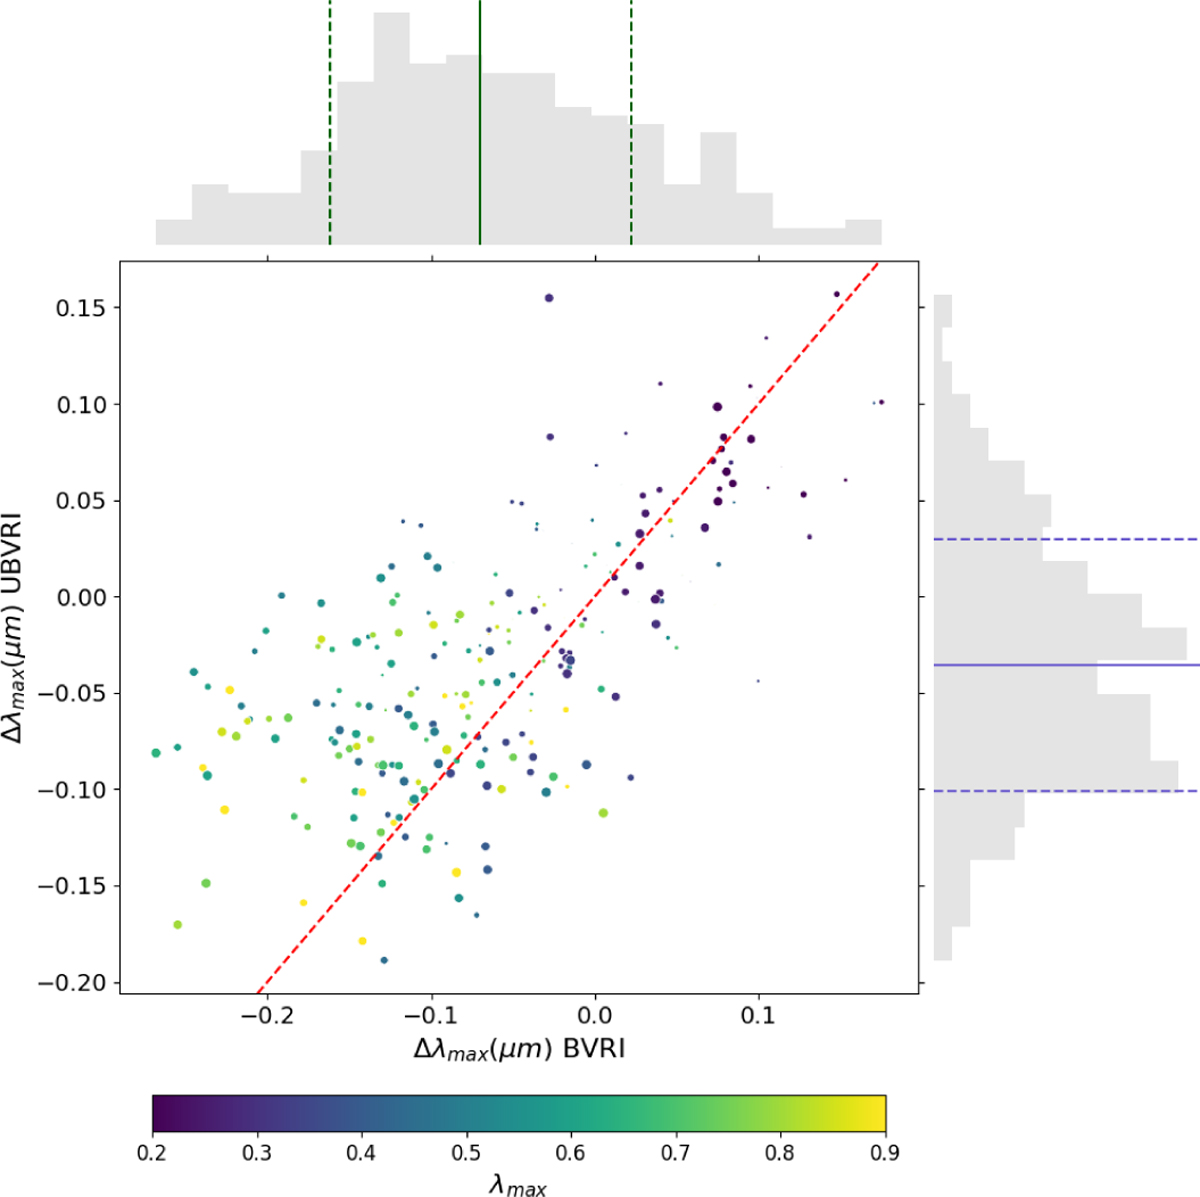
Difference between fitted and simulated maximum wavelength of polarization, ∆λmax = λmax,fit − λmax,sim using fits to UBVRI vs. only BVRI data. The size of the points represent the simulated pmax, while the colors represent the simulated λmax. The histograms show the distribution of both differences with the median and deviation shown in solid and dashed lines.
Current usage metrics show cumulative count of Article Views (full-text article views including HTML views, PDF and ePub downloads, according to the available data) and Abstracts Views on Vision4Press platform.
Data correspond to usage on the plateform after 2015. The current usage metrics is available 48-96 hours after online publication and is updated daily on week days.
Initial download of the metrics may take a while.