Fig. 4
Download original image
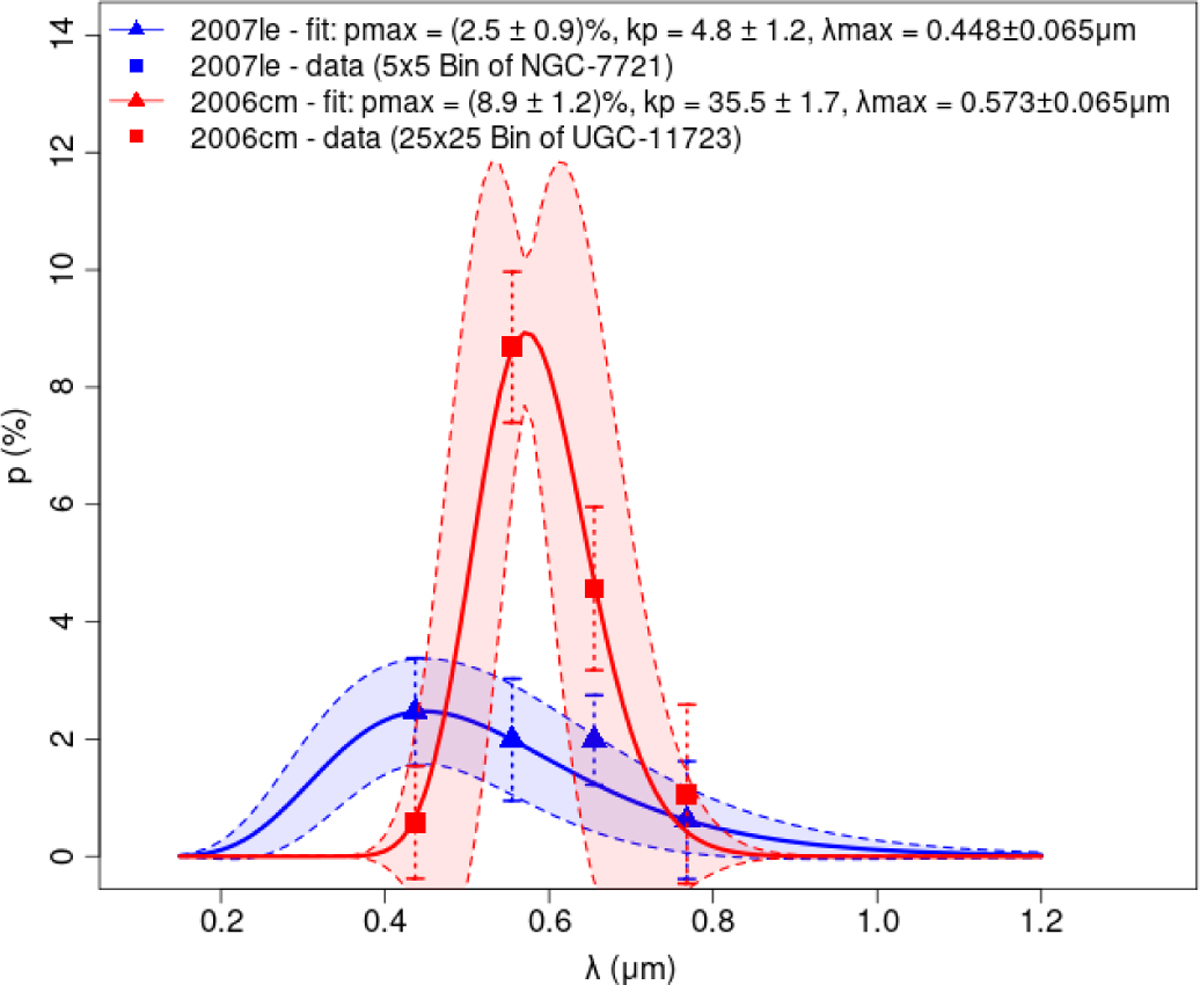
Two different Serkowski relations illustrating the effect of each parameter on the curve. pmax yields the maximum polarization degree and occurs at λ = λmax, while kp relates to the width of the curve. The blue and red lines represent Serkowski models for the vicinities of 2007le and 2006cm, respectively, while the same colored symbols indicate the polarimetry, which yielded those models. The shaded areas indicate the 1σ confidence interval of the model predictions.
Current usage metrics show cumulative count of Article Views (full-text article views including HTML views, PDF and ePub downloads, according to the available data) and Abstracts Views on Vision4Press platform.
Data correspond to usage on the plateform after 2015. The current usage metrics is available 48-96 hours after online publication and is updated daily on week days.
Initial download of the metrics may take a while.