Fig. 6
Download original image
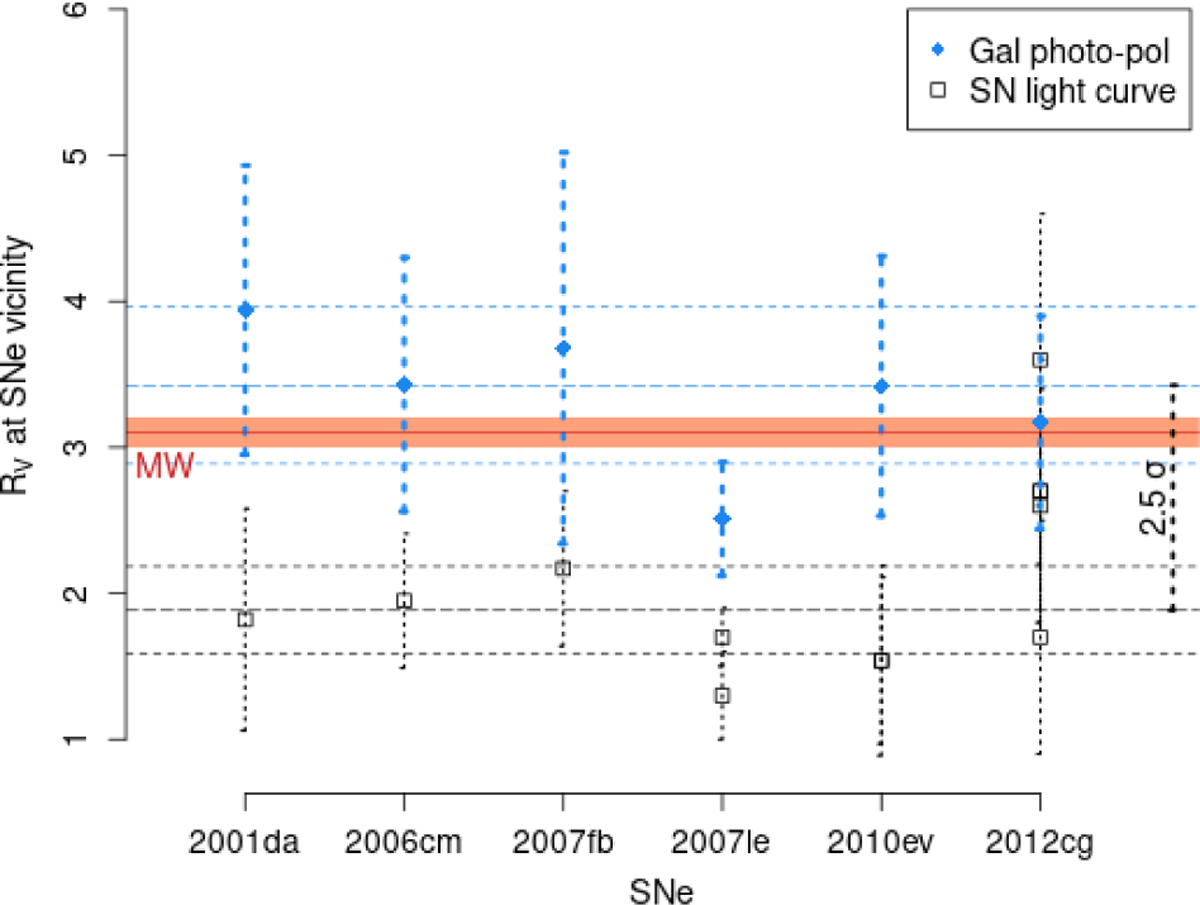
Comparison of RV estimated in the vicinity of SNe with estimates from direct observations of SNe. Blue dots are estimates obtained using late-time (several years post maximum light) multiwaveband photopolarimetry in the vicinity of SNe. Black squares are estimates based on model fitting to color LC data of those SNe (Mandel et al. 2011; Phillips et al. 2013; Burns et al. 2014; Amanullah et al. 2015; Gutiérrez et al. 2016). The median, and its uncertainty, of each estimation are presented by dashed lines in the corresponding color. The fiducial RV for the Milky Way is presented by a red line with its uncertainty being the shaded orange area. A 2.5σ separation is observed between the median of RV estimates obtained with photopolarimetry and with LC data.
Current usage metrics show cumulative count of Article Views (full-text article views including HTML views, PDF and ePub downloads, according to the available data) and Abstracts Views on Vision4Press platform.
Data correspond to usage on the plateform after 2015. The current usage metrics is available 48-96 hours after online publication and is updated daily on week days.
Initial download of the metrics may take a while.