Open Access
Fig. 7
Download original image
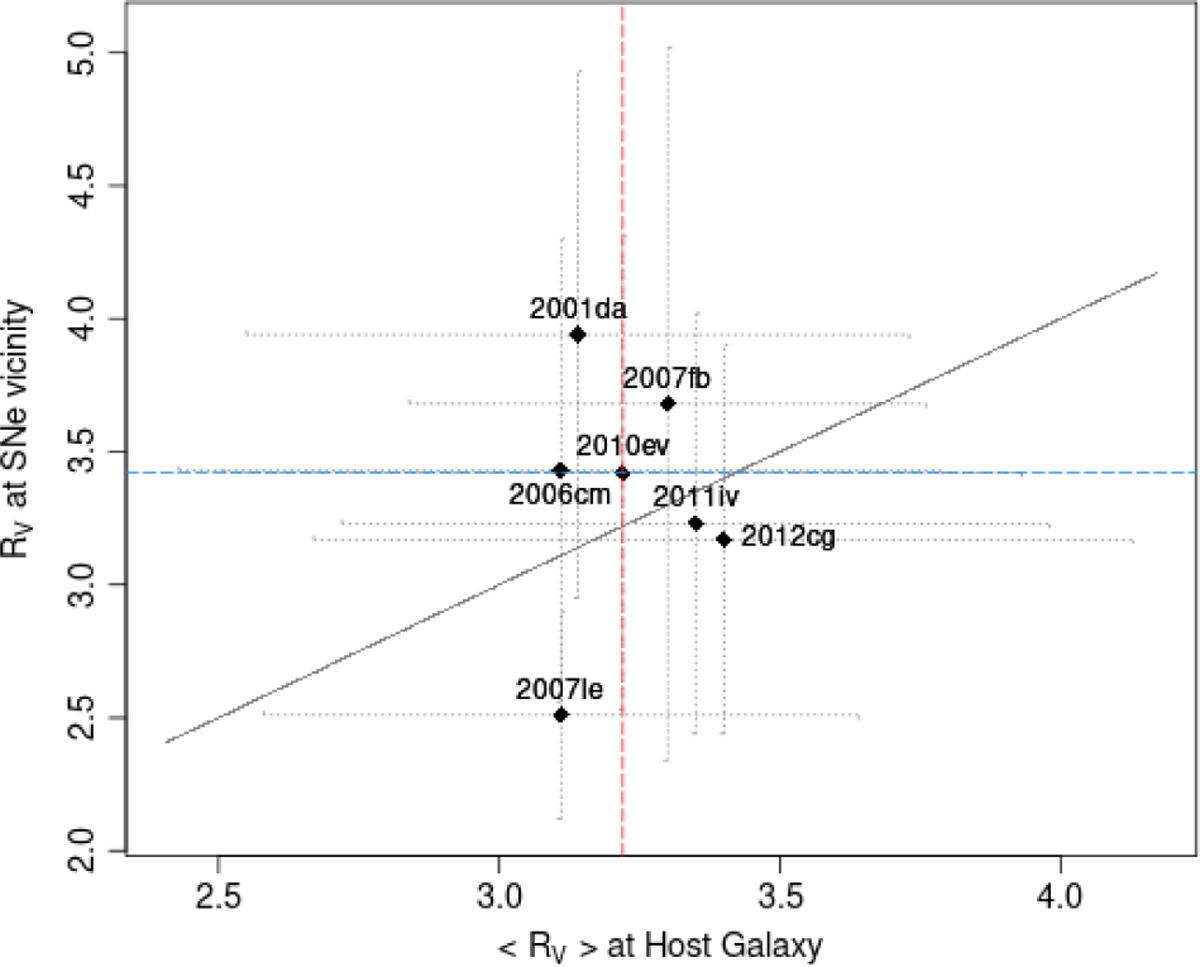
Median RV in the vicinity of the hosted SNe versus the median RV for the present sample of hosts of SNe, < RV >. The dashed red line marks the median of the HGs < RV >, while the dashed blue line indicates the median of the RV in the vicinity of SNe. The black line represents an ideal 1:1 relation.
Current usage metrics show cumulative count of Article Views (full-text article views including HTML views, PDF and ePub downloads, according to the available data) and Abstracts Views on Vision4Press platform.
Data correspond to usage on the plateform after 2015. The current usage metrics is available 48-96 hours after online publication and is updated daily on week days.
Initial download of the metrics may take a while.