Fig. 1
Download original image
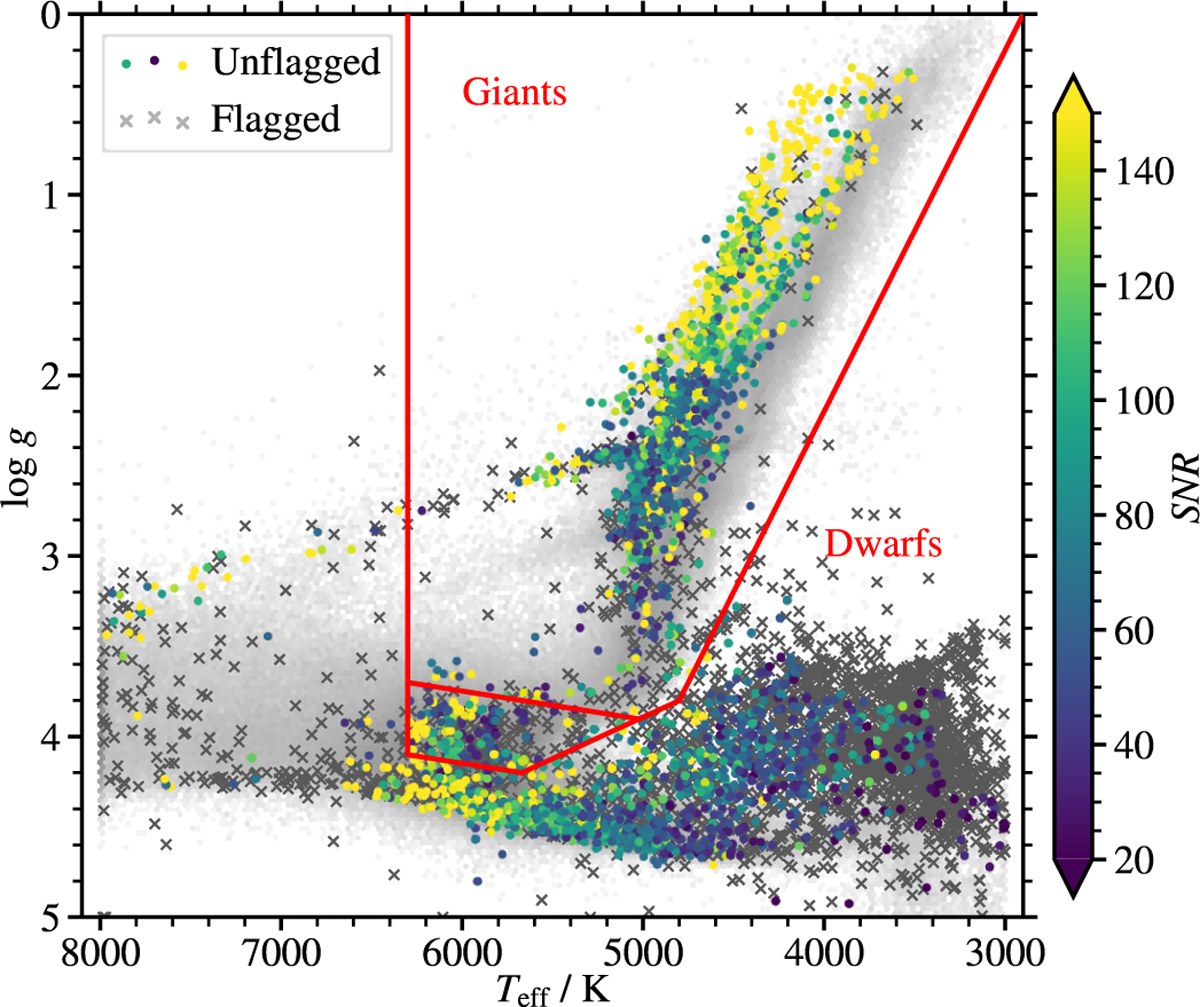
Kiel diagram of the stars used to compute the trends. Unflagged stars are plotted with colours and flagged stars with grey crosses. The grey background distribution shoes all stars in GALAH DR4. Regions delineating dwarfs, giants, and the overlap region are marked in red. The equations of all red lines are specified in Equation (1).
Current usage metrics show cumulative count of Article Views (full-text article views including HTML views, PDF and ePub downloads, according to the available data) and Abstracts Views on Vision4Press platform.
Data correspond to usage on the plateform after 2015. The current usage metrics is available 48-96 hours after online publication and is updated daily on week days.
Initial download of the metrics may take a while.