Fig. 10
Download original image
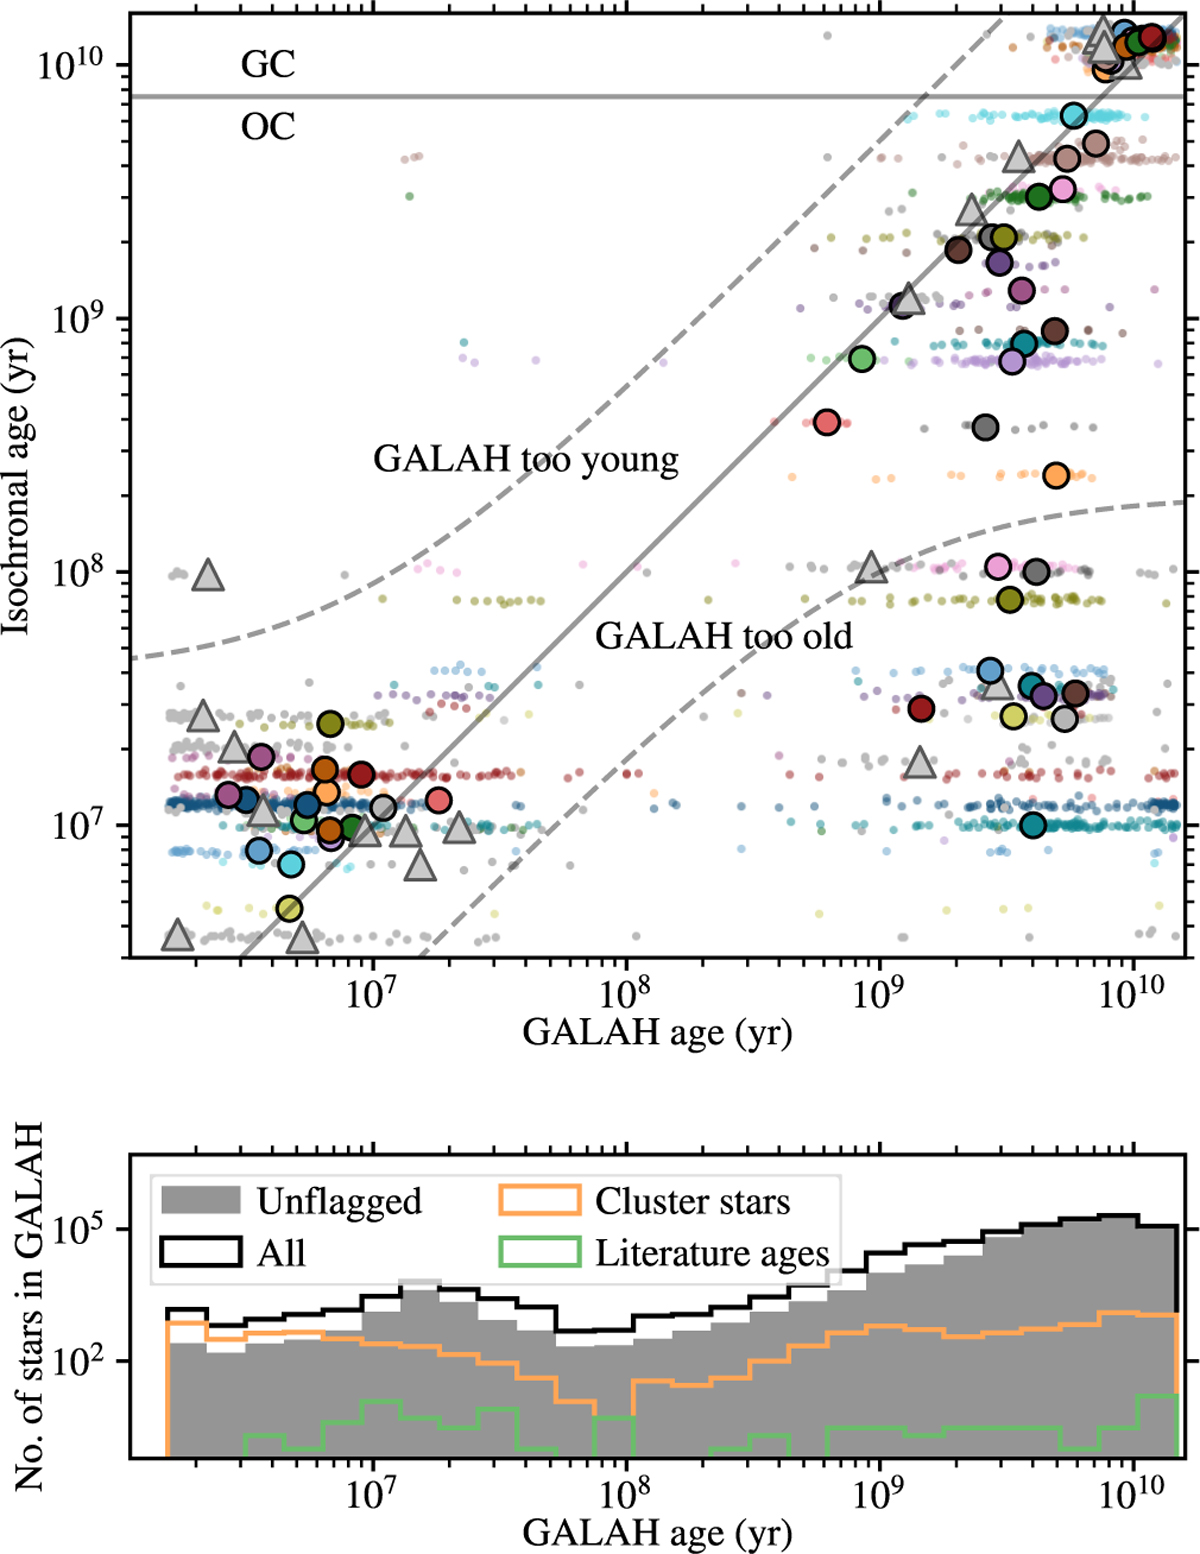
Comparison between GALAH’s ages and isochronal ages. Top: Ages of individual stars in clusters are plotted as small dots (artificially slightly scattered vertically for better perception). The median for each cluster is plotted with a circle of the same colour. Medians marked with a triangle are for clusters with only flagged stars. A one-to-one relation is indicated. A horizontal line separates open clusters from globular clusters. Note a bimodal distribution of GALAH ages for some clusters; one peak is at around 107 yr and another at around 5.0 × 10⁹ yr. Dashed lines mark the region used in the calculation of statistical uncertainties of stellar ages. Bottom: Distribution of stars in log-spaced age bins. Black line shows all stars and the grey area shows unflagged stars. Both distributions are for the whole GALAH DR4 sample. Orange histogram shows the distribution of GALAH ages for cluster members, and the green histogram for individual clusters’ literature ages. A diagram with added cluster names is given in Appendix E.
Current usage metrics show cumulative count of Article Views (full-text article views including HTML views, PDF and ePub downloads, according to the available data) and Abstracts Views on Vision4Press platform.
Data correspond to usage on the plateform after 2015. The current usage metrics is available 48-96 hours after online publication and is updated daily on week days.
Initial download of the metrics may take a while.