Open Access
Fig. 13
Download original image
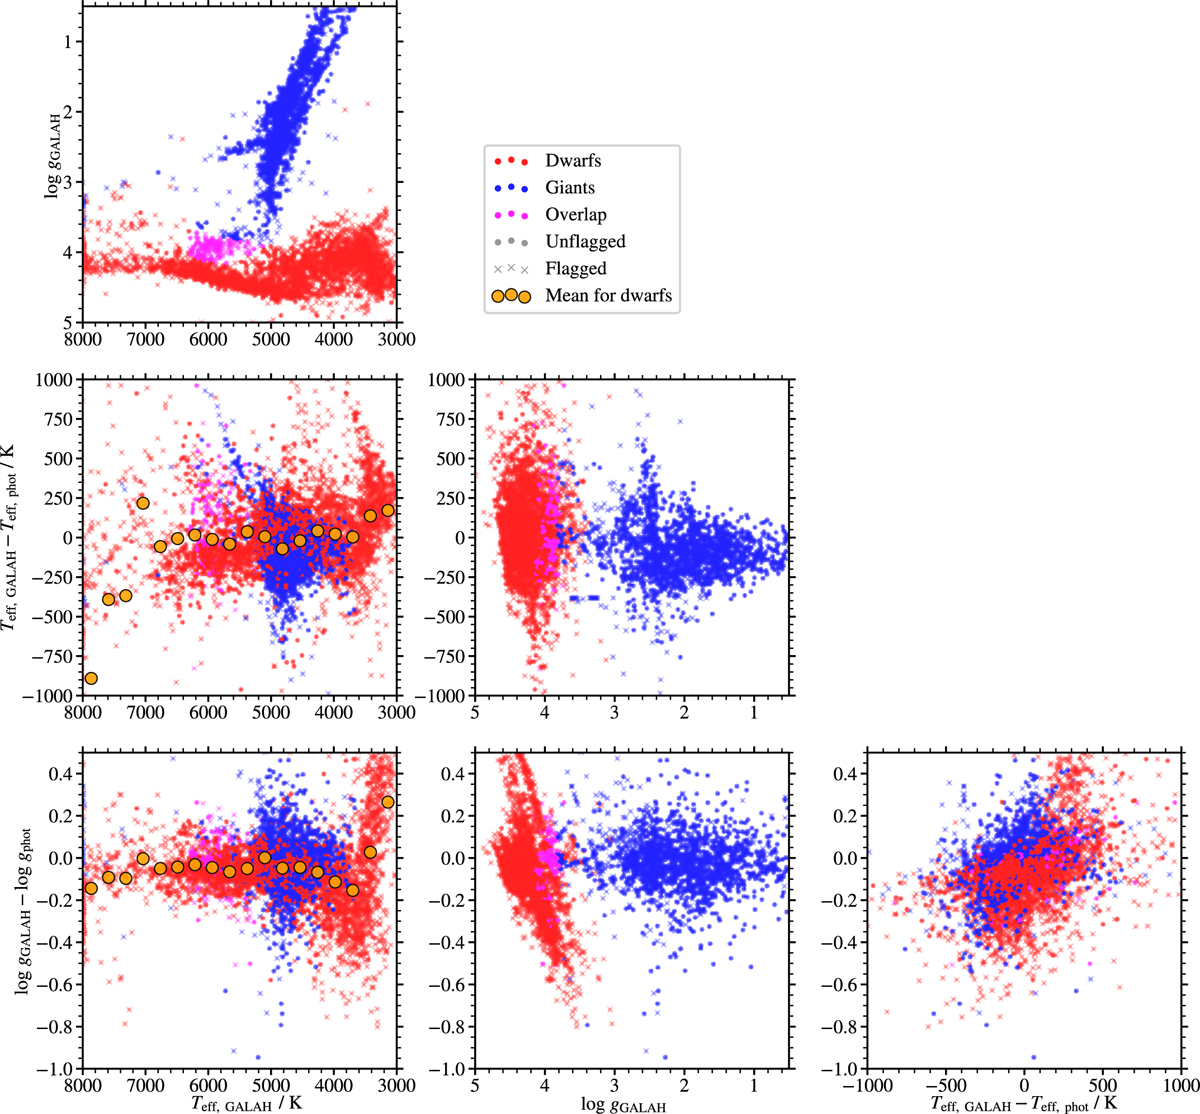
Relationship between photometric Teff and log g, spectroscopic Teff and log g and their respective differences. Red symbols show dwarfs, blue symbols giants, and purple symbols the overlap region. Orange symbols show the averaged values for dwarfs. Only stars with good photometric data are shown.
Current usage metrics show cumulative count of Article Views (full-text article views including HTML views, PDF and ePub downloads, according to the available data) and Abstracts Views on Vision4Press platform.
Data correspond to usage on the plateform after 2015. The current usage metrics is available 48-96 hours after online publication and is updated daily on week days.
Initial download of the metrics may take a while.