Fig. 14
Download original image
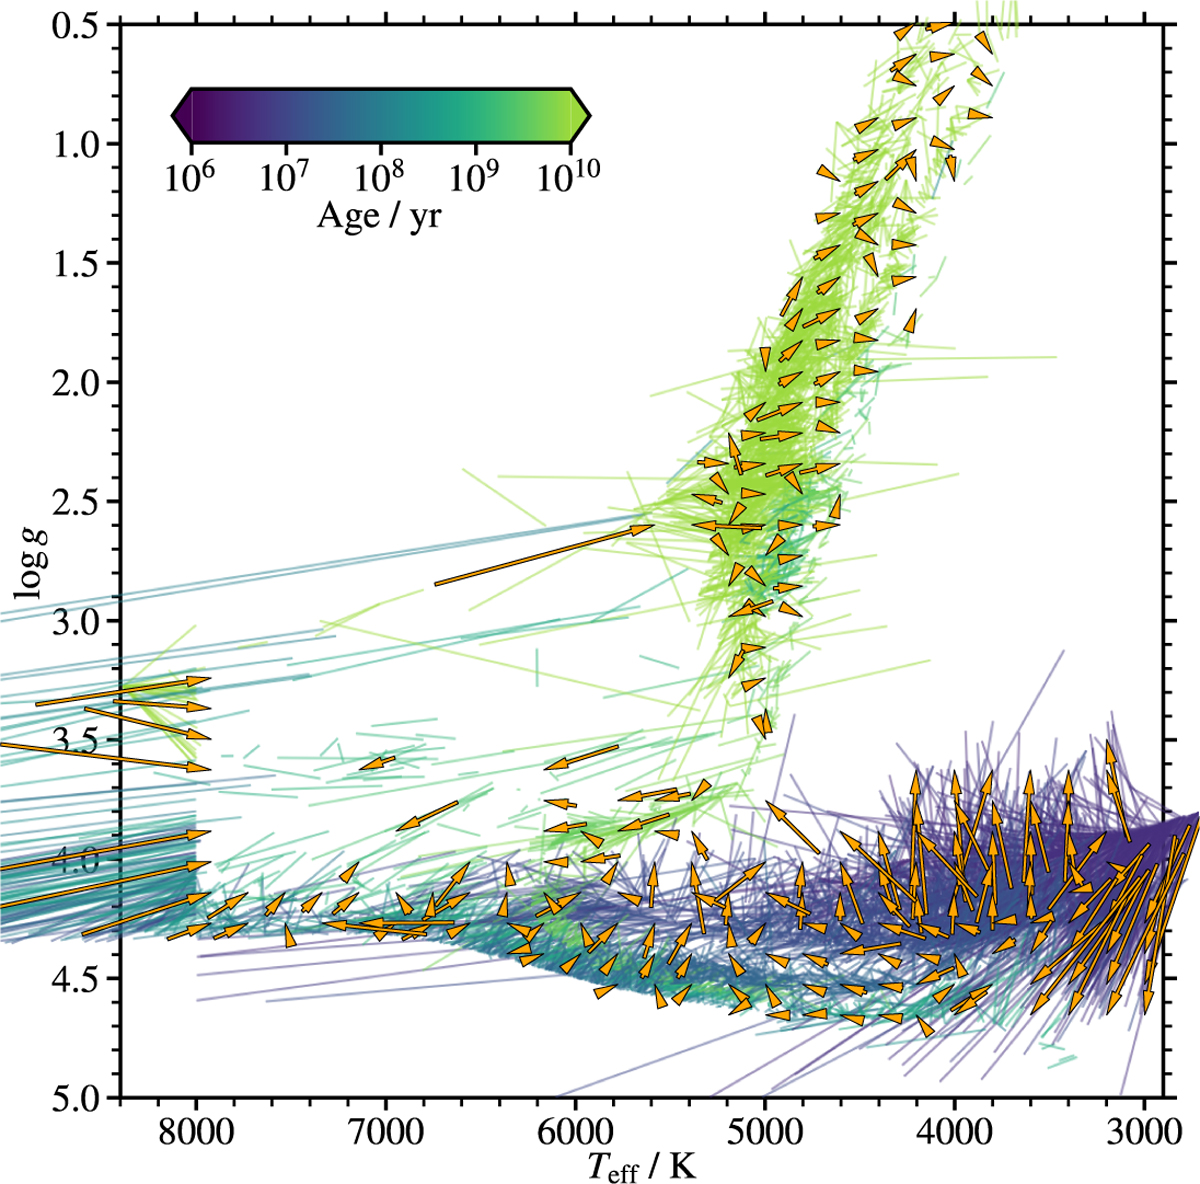
Illustration of the photometric and spectroscopic Teff and log g. Arrows point from the photometric values to the spectroscopic values. Thin lines show the value pairs for each star, and orange arrows for the average flow in that region. Photometric temperatures are sometimes far outside the plotted range, which explains the lines coming from outside of the panel.
Current usage metrics show cumulative count of Article Views (full-text article views including HTML views, PDF and ePub downloads, according to the available data) and Abstracts Views on Vision4Press platform.
Data correspond to usage on the plateform after 2015. The current usage metrics is available 48-96 hours after online publication and is updated daily on week days.
Initial download of the metrics may take a while.