Fig. 15
Download original image
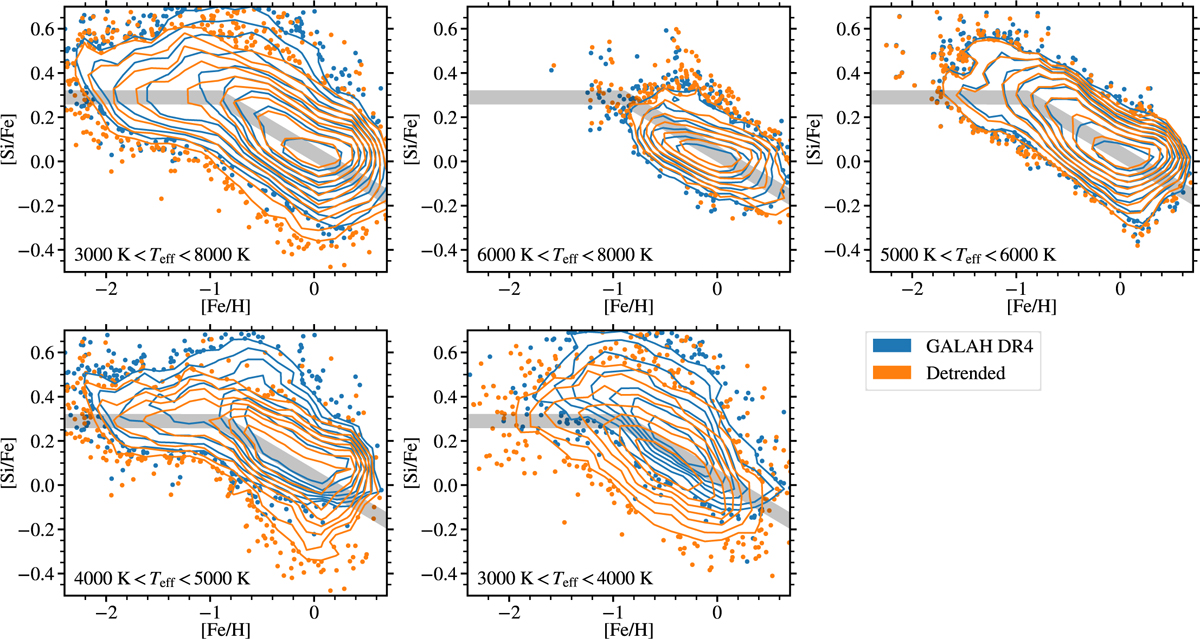
[Fe/H] vs. [Si/Fe] diagrams for stars in different temperature bins. Contours show the density of stars in GALAH DR4 table (blue) and in the detrended table produced in this work (ornage). Stars outside the lowest contour are plotted as points. The grey line shows the general shape of the diagram, so it is easier to compare the positions and shapes of the contours in each panel. Only stars with flag_sp< 4 and with no flags in Iron or Silicon abundances are plotted.
Current usage metrics show cumulative count of Article Views (full-text article views including HTML views, PDF and ePub downloads, according to the available data) and Abstracts Views on Vision4Press platform.
Data correspond to usage on the plateform after 2015. The current usage metrics is available 48-96 hours after online publication and is updated daily on week days.
Initial download of the metrics may take a while.