Fig. 2
Download original image
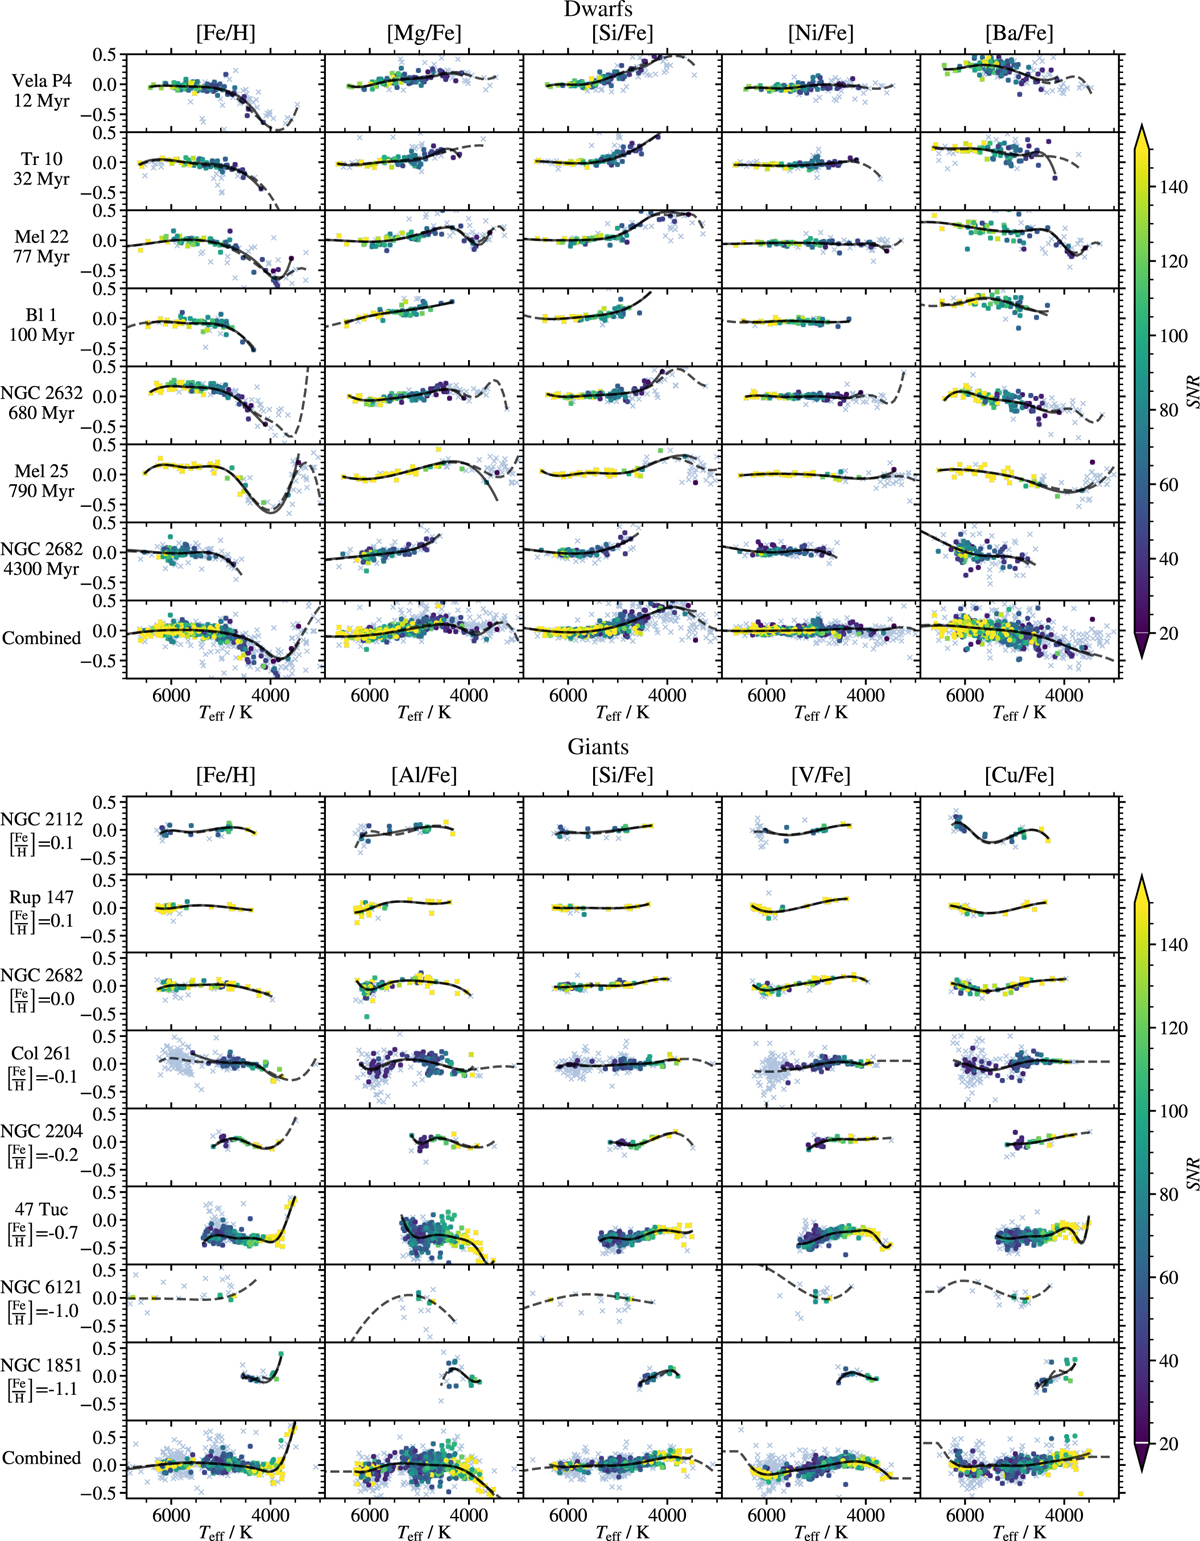
Trends for several clusters illustrated for a small selection of elements. Top: Trends for seven open clusters and associations. The last row shows the combined measurements. Bottom: Trends for eight open and globular clusters. Quantities in the first column are shifted by the value of [Fe/H] given under the cluster’s name, so they fit into the same plotting range. The coloured points are unflagged stars; grey crosses are flagged stars. The solid line is a fit for unflagged stars; the dashed line is a fit for all stars. Trends fitted to the complete dataset of clusters are different from those in this illustration and are explained in Section 3.4 and Appendix B.
Current usage metrics show cumulative count of Article Views (full-text article views including HTML views, PDF and ePub downloads, according to the available data) and Abstracts Views on Vision4Press platform.
Data correspond to usage on the plateform after 2015. The current usage metrics is available 48-96 hours after online publication and is updated daily on week days.
Initial download of the metrics may take a while.