Fig. 3.
Download original image
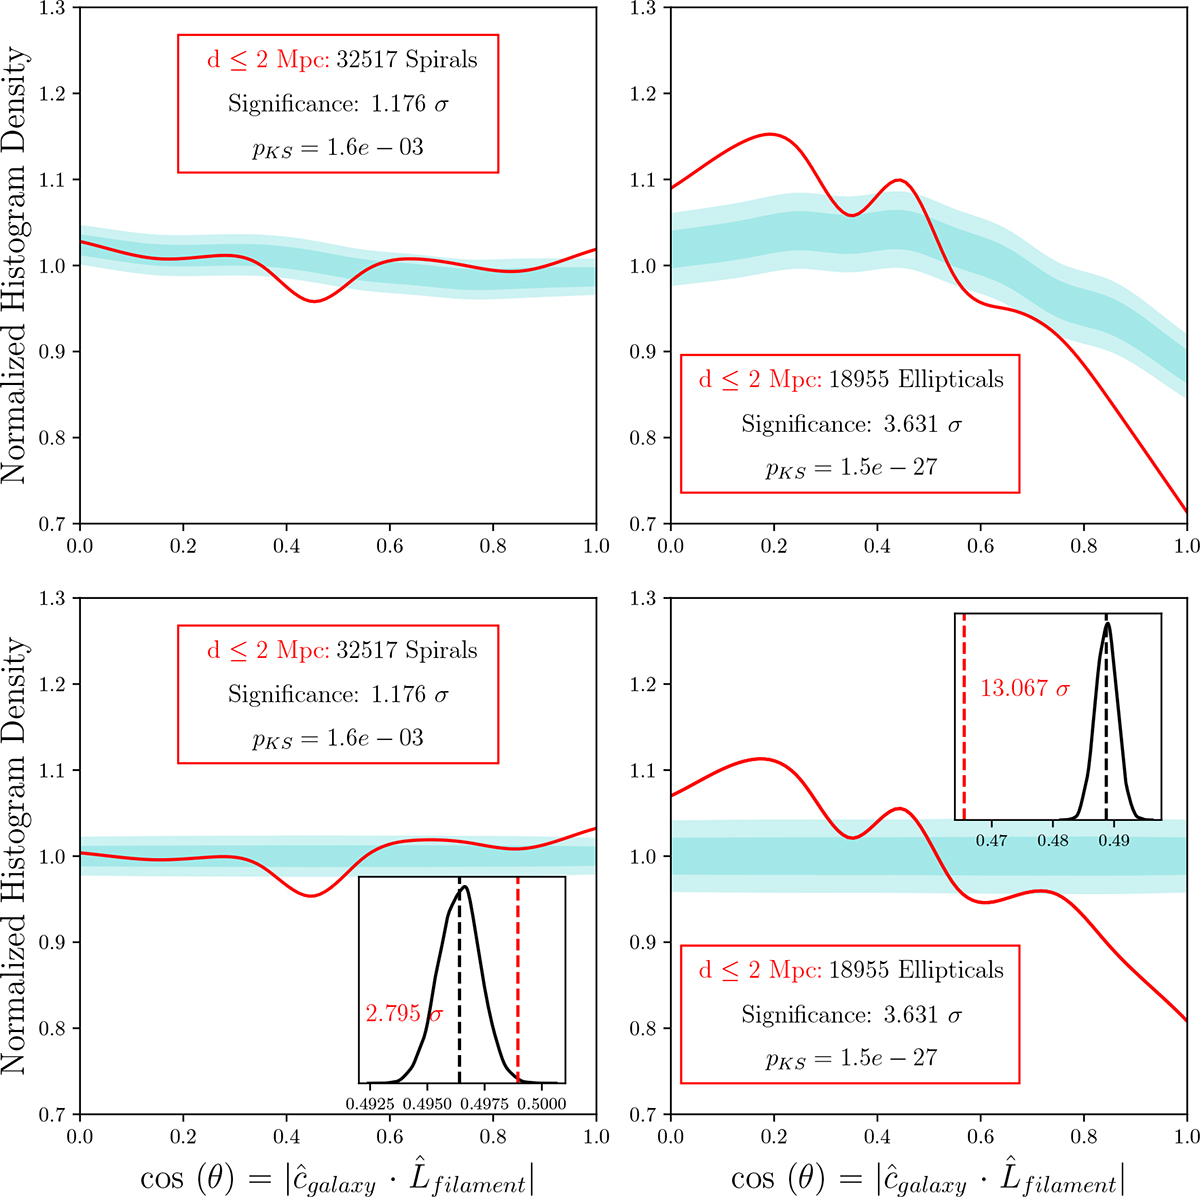
Normalized histogram of cosines of the angles between spines of the filaments and the spin axes of spiral and elliptical galaxies within 2 Mpc (![]() ). The upper panels show the raw alignment signal. The dark cyan band represents the 1 σ null hypothesis corridor, beyond which the probability density function is deemed significant, while the light cyan band provides a 2σ corridor as a visual comparison. The significance of the alignment signal is expressed in terms of the standard deviations (1σ) from the random distribution of the null hypothesis. The p value from the KS test is included to quantify the probability of observing the alignment signal from the given null hypothesis. The lower panels present the alignment signal normalized by the mean random signal such that a random distribution would appear uniform in cos θ. An inset plot depicting the mean of the alignment signal (red line) along with the distribution of the mean from the null hypothesis cases has been inserted to visualize how much further the mean of the alignment signal is from the median of the distribution of the mean from the null hypothesis cases (black line), in terms of the standard deviation of the distribution (σ⟨cosθ⟩). The inset plots also includes the σ⟨cosθ⟩ values for both distribution, denoted in red text.
). The upper panels show the raw alignment signal. The dark cyan band represents the 1 σ null hypothesis corridor, beyond which the probability density function is deemed significant, while the light cyan band provides a 2σ corridor as a visual comparison. The significance of the alignment signal is expressed in terms of the standard deviations (1σ) from the random distribution of the null hypothesis. The p value from the KS test is included to quantify the probability of observing the alignment signal from the given null hypothesis. The lower panels present the alignment signal normalized by the mean random signal such that a random distribution would appear uniform in cos θ. An inset plot depicting the mean of the alignment signal (red line) along with the distribution of the mean from the null hypothesis cases has been inserted to visualize how much further the mean of the alignment signal is from the median of the distribution of the mean from the null hypothesis cases (black line), in terms of the standard deviation of the distribution (σ⟨cosθ⟩). The inset plots also includes the σ⟨cosθ⟩ values for both distribution, denoted in red text.
Current usage metrics show cumulative count of Article Views (full-text article views including HTML views, PDF and ePub downloads, according to the available data) and Abstracts Views on Vision4Press platform.
Data correspond to usage on the plateform after 2015. The current usage metrics is available 48-96 hours after online publication and is updated daily on week days.
Initial download of the metrics may take a while.